
Vizb
![]()
![]()
![]()
![]()

![]()
A tabular visualization engine for CSV, JSON, and benchmark output. Turns numeric columns into interactive charts and descriptive statistics in one self-contained HTML file — no server, no dependencies, no build step.
Getting Started ·
Commands ·
Charts ·
Parsers ·
Grouping ·
Select ·
Merging ·
CI/CD
Full documentation at vizb.goptics.org
Quick Install
Linux / macOS
curl -fsSL https://vizb.goptics.org/install.sh | bash
Windows
irm https://vizb.goptics.org/install.ps1 | iex
Download Binary
Pre-built binaries for Linux, macOS, and Windows are available on the releases page.
Quick Example
Run one command to turn your GitHub contribution history into a 3D skyline of your activity over time. Each year stacks as a new layer; within it, every day is a column whose height is your contribution count. Replace <your-github-username> with your GitHub username and open the generated index.html.
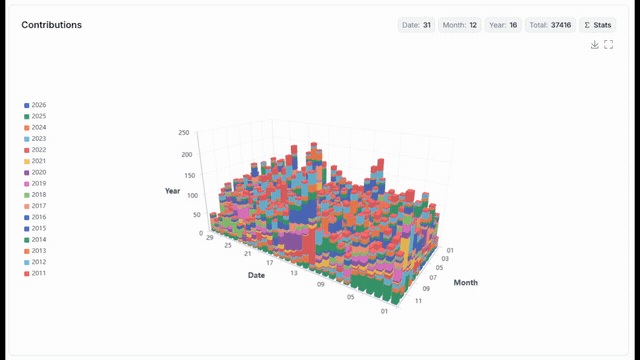
Example: torvalds contribution history
Linux / macOS
curl -s "https://github-contributions-api.jogruber.de/v4/<your-github-username>" \
  | vizb bar \
      --group date \
      --group-pattern '[z{Year}-y{Month}-x{Date}]' \
      --json-path '.contributions' \
      --select 'count{Contributions}' \
      --stat \
      --output index.html
Windows
(iwr "https://github-contributions-api.jogruber.de/v4/<your-github-username>").Content `
  | vizb bar `
      --group date `
      --group-pattern '[z{Year}-y{Month}-x{Date}]' `
      --json-path '.contributions' `
      --select 'count{Contributions}' `
      --stat `
      --output index.html
Flags used:
--group date— group rows by date--group-pattern '[z{Year}-y{Month}-x{Date}]'— split each date into Year / Month / Day axes (z / y / x)--json-path '.contributions'— pull the nested contributions array out of the API envelope--select 'count{Contributions}'— keep only the count column and rename it toContributions--stat— add the statistics panel--output index.html— write a self-contained HTML file
Contributing
Contributions are welcome! See CONTRIBUTING.md for setup, build/test commands, and how to add a parser.
License
This project is licensed under the MIT License — see the LICENSE file for details.