
ta4j 


Technical Analysis for Java

Build, test, and deploy trading bots in Java. With 200+ (and counting) technical indicators, intuitive APIs, and production-minded tooling, you can explore markets, validate trading ideas, visualize signals, and ship automated bots without leaving the JVM.
Table of Contents
- Why Ta4j?
- Install in seconds
- Build commands: Maven
- Quick start: Your first strategy
- Forecast predictions
- Sourcing market data
- Visualize and share strategies
- Features at a glance
- Evaluate performance with metrics
- From backtest to live trading
- Real-world examples
- Performance
- Community & Support
- What's next?
- Contributing
Why Ta4j?
Build, test, and deploy trading strategies in Java without leaving your preferred language, toolchain, or mental model. Ta4j provides the building blocks needed to explore markets, validate ideas, and move from curiosity to production-grade systems.
Ta4j treats technical analysis for what it is: a structured way to reason about uncertainty using historical price data. As often stated, past performance is no guarantee of future results. History doesn't repeat, but it often rhymes. Technical indicators are about probabilities rather than predictions. They help us understand the art of the possible and, when used well, the art of alpha from the probable.
⚡ Performance Advantage: Native multi-threading gives ta4j a significant comparative advantage over Python-based libraries. Backtest hundreds of strategies in parallel, process years of market data in seconds, and saturate all CPU cores. No GIL bottleneck, no multiprocessing workarounds, just straightforward parallel execution.
Because Ta4j runs on the JVM, strategies scale naturally from a single backtest on a laptop to large parameter sweeps, portfolio simulations, and research pipelines. Strong typing and explicit models make strategies easier to reason about, harder to misuse, and less likely to quietly do the wrong thing.
Ta4j does not promise profitable strategies. It promises reproducible experiments. If a strategy looks good, Ta4j helps you verify it. If it stops working, Ta4j helps you understand why. And if a backtest looks too good to be true, it's on you to choose skepticism over motivated thinking.
What can you build?
- Backtest trading strategies: Test "what if" scenarios on historical data before risking real money
- Paper trading bots: Run strategies live against market data without placing real orders
- Research tools: Analyze market patterns, compare indicators, and explore new trading ideas
- Automated trading systems: Deploy production bots that execute trades based on your strategies
- Market analysis dashboards: Build visualizations and reports for your trading research
Why Java developers choose Ta4j
- Pure Java, zero friction: Works anywhere Java 25+ runs - cloud functions, desktop tools, microservices, or trading bots. No Python bridges or external dependencies.
- Type-safe, Production-ready: Ta4j favors explicit models, strong typing, and predictable performance over exploratory scripting. Deterministic outputs, JSON serialization for strategies/indicators, and minimal dependencies make it easy to deploy.
- Huge indicator catalog: Aroon, ATR, Ichimoku, MACD, RSI, Renko, Heikin-Ashi, and 190+ more ready to plug together. New indicators are added regularly based on community needs and contributions.
- Composable strategies: Chain rules fluently using familiar Java patterns - no DSLs or configuration files required.
- Backtesting built-in: Evaluate risk/reward with realistic trading costs and performance metrics in just a few lines.
- MIT licensed: Use it at work, in research, or inside your next trading product without legal concerns.
Install in seconds
Add Ta4j from Maven Central:
<dependency>
  <groupId>org.ta4j</groupId>
  <artifactId>ta4j-core</artifactId>
  <version>0.23.0</version>
</dependency>
Prefer living on the edge? Use the snapshot repository and version:
<repository>
  <id>central-portal-snapshots</id>
  <url>https://central.sonatype.com/repository/maven-snapshots/</url>
  <releases><enabled>false</enabled></releases>
  <snapshots><enabled>true</enabled></snapshots>
</repository>

<dependency>
  <groupId>org.ta4j</groupId>
  <artifactId>ta4j-core</artifactId>
  <version>0.23.1-SNAPSHOT</version>
</dependency>
Sample applications are also published so you can copy/paste entire flows:
<dependency>
  <groupId>org.ta4j</groupId>
  <artifactId>ta4j-examples</artifactId>
  <version>0.23.0</version>
</dependency>
Like living on the edge? Use the snapshot version of ta4j-examples for the latest experimental/beta features:
<dependency>
  <groupId>org.ta4j</groupId>
  <artifactId>ta4j-examples</artifactId>
  <version>0.23.1-SNAPSHOT</version>
</dependency>
💡 Tip: The ta4j-examples module includes runnable demos, data loaders, and charting utilities. It's a great way to see Ta4j in action and learn by example.
Build commands: Maven
Ta4j requires Java 25+. The repository includes Maven Wrapper scripts pinned to Maven 3.9.16, so contributors do not need a separate Maven install.
- Standard build command: Use
./mvnw ...on macOS/Linux,mvnw.cmd ...on Windows, ormvn ...when you intentionally use system Maven 3.9+ - Contributor quality path: Use
scripts/run-full-build-quiet.shon macOS/Linux/Git Bash/WSL orscripts/run-full-build-quiet.ps1on Windows PowerShell with Git Bash available onPATH. The local default runs actionlint and repository script fixtures, repairs license headers and formatting, then runs all non-demo Maven tests with blocking SpotBugs plus advisory JaCoCo feedback. The Bash entrypoint keeps the default 180-second watchdog as the earliest timeout point, then allows continued Maven output progress until the configurable no-output stall window expires. Review any source changes it makes before committing. - Maven-only local equivalent: Use
./mvnw -B clean license:format formatter:format verify -Dta4j.excludedTestTags=analysis-demo,benchmark,requires-display,requires-headless,mvnw.cmdwith the same arguments, or system Maven 3.9+ when repository preflight checks are not needed. - Hosted validation path: CI uses
scripts/run-full-build-quiet.sh --validate-only, equivalent to./mvnw -B clean license:check formatter:validate verify -Dta4j.excludedTestTags=analysis-demo,benchmark,requires-display,requires-headless, so committed source defects still fail without modifying the checkout. You can also run./mvnw -B license:format formatter:formatas a focused repair command. - SpotBugs-only local gate: Use
./mvnw -pl ta4j-core -am clean compile spotbugs:checkto compile from a clean module output and fail fast on module-scoped findings before rerunning the full build - JaCoCo-only local gate: Use
./mvnw -pl ta4j-core -am test jacoco:report jacoco:checkto run tests, generate coverage output, and enforce the module threshold locally - Focused coverage report: Use
./mvnw -pl ta4j-core -am -Dtest=BarSeriesManagerTest -Dsurefire.failIfNoSpecifiedTests=false test jacoco:reportwhen you want a quick report without enforcing the bundle threshold yet
Run the quiet build script before opening or updating a pull request.
Try it now
Option 1: Run the Quickstart example (2-3 minutes)
# Clone the repository
git clone https://github.com/ta4j/ta4j.git
cd ta4j

# Build the project first (Linux/macOS/Git Bash)
mvn clean install -DskipTests

# Run the Quickstart example (Quickstart is configured as the default)
./mvnw -pl ta4j-examples exec:java
Alternative: To run a different example class:
./mvnw -pl ta4j-examples exec:java -Dexec.mainClass=ta4jexamples.backtesting.TradingRecordParityBacktest
This will load historical Bitcoin data, run a complete trading strategy, display performance metrics, and show an interactive chart - all in one go!
Option 2: Copy the code into your project (requires ta4j-core and ta4j-examples dependencies)
See the Quick start: Your first strategy section below for a complete, runnable example you can paste into your IDE.
Quick start: Your first strategy
Load price data, plug in indicators, and describe when to enter/exit. The API reads like the trading notes you already keep.
💡 Want to see this in action? The Quickstart example includes this same pattern plus performance metrics and charting. Run it with:
./mvnw -pl ta4j-examples exec:java
Key concepts:
- Indicators: Calculate values from price data (e.g., moving averages, RSI, MACD)
- Rules: Boolean conditions that determine when to enter or exit trades
- Strategies: Combine entry and exit rules into a complete trading system
- BarSeries: Your price data (OHLCV bars) that everything operates on
Note: The example below uses BitStampCsvTradesFileBarSeriesDataSource from ta4j-examples for convenience. See the Sourcing market data section below for more options.
import org.ta4j.core.*;
import org.ta4j.core.indicators.EMAIndicator;
import org.ta4j.core.indicators.helpers.ClosePriceIndicator;
import org.ta4j.core.rules.*;
import org.ta4j.core.backtest.BarSeriesManager;
import ta4jexamples.datasources.BitStampCsvTradesFileBarSeriesDataSource;  // Requires ta4j-examples dependency

// Load historical price data (or use your own data source)
BarSeries series = BitStampCsvTradesFileBarSeriesDataSource.loadBitstampSeries();

// Create indicators: calculate moving averages from close prices
ClosePriceIndicator close = new ClosePriceIndicator(series);
EMAIndicator fastEma = new EMAIndicator(close, 12);  // 12-period EMA
EMAIndicator slowEma = new EMAIndicator(close, 26);  // 26-period EMA

// Define entry rule: buy when fast EMA crosses above slow EMA (golden cross)
Rule entry = new CrossedUpIndicatorRule(fastEma, slowEma);

// Define exit rule: sell when price gains 3% OR loses 1.5%
Rule exit = new StopGainRule(close, 3.0)      // take profit at +3%
        .or(new StopLossRule(close, 1.5));    // or cut losses at -1.5%

// Combine rules into a strategy
Strategy strategy = new BaseStrategy("EMA Crossover", entry, exit);

// Run the strategy on historical data
BarSeriesManager manager = new BarSeriesManager(series);
TradingRecord record = manager.run(strategy);

// See the results
System.out.println("Number of trades: " + record.getTradeCount());
System.out.println("Number of positions: " + record.getPositionCount());
Forecast predictions
Forecast indicators produce forward-looking estimates at a decision index while
staying inside the normal ta4j Indicator model. A forecast made at index i
only reads source values through i; evaluation code can later
compare it with the realized value at i + horizon.
import org.ta4j.core.BarSeries;
import org.ta4j.core.Indicator;
import org.ta4j.core.criteria.ReturnRepresentation;
import org.ta4j.core.indicators.forecast.EwmaReturnForecastStateIndicator;
import org.ta4j.core.indicators.forecast.AnalogReturnProjectionIndicator;
import org.ta4j.core.indicators.forecast.MonteCarloPriceForecastIndicator;
import org.ta4j.core.indicators.forecast.OnlineChangePointForecastStateIndicator;
import org.ta4j.core.indicators.forecast.RollingConformalForecastProjectionIndicator;
import org.ta4j.core.indicators.forecast.RoughVolatilityForecastStateIndicator;
import org.ta4j.core.indicators.forecast.projection.Forecast;
import org.ta4j.core.indicators.forecast.projection.ForecastProjectionIndicator;
import org.ta4j.core.indicators.forecast.projection.ReturnForecastProjectionIndicator;
import org.ta4j.core.indicators.forecast.state.ForecastFeatureExtractor;
import org.ta4j.core.indicators.forecast.state.ForecastFeatureExtractors;
import org.ta4j.core.indicators.forecast.state.OnlineChangePointForecastState;
import org.ta4j.core.indicators.forecast.state.ReturnForecastState;
import org.ta4j.core.indicators.forecast.state.ReturnForecastStateIndicator;
import org.ta4j.core.indicators.forecast.state.RoughVolatilityForecastState;
import org.ta4j.core.indicators.helpers.LogReturnIndicator;
import org.ta4j.core.num.Num;

BarSeries series = ...;
LogReturnIndicator returns = new LogReturnIndicator(series);
ReturnForecastStateIndicator<ReturnForecastState> state = new EwmaReturnForecastStateIndicator(returns);
ForecastProjectionIndicator nextCloseForecast = new MonteCarloPriceForecastIndicator(state, 5);

Indicator<Num> medianNextClose = nextCloseForecast.median();
Indicator<Num> downsideNextClose = nextCloseForecast.quantile(0.05);
Forecasts are estimates, not guarantees. Use deterministic seeds and explicit projection indicators so research runs can be repeated and evaluated against later realized prices.
ReturnIndicator is a semantic contract: implementations promise that their
numeric output is a return stream in the declared representation. The initial
forecast implementation supports log returns, so build the pipeline explicitly
from LogReturnIndicator to EwmaReturnForecastStateIndicator to
MonteCarloPriceForecastIndicator. Its builder exposes advanced simulation
tuning without leaving the exact path-based price model, and its explicit-price
overloads support custom log-return sources whose price indicator cannot be
inferred. Use LognormalApproximationPriceForecastIndicator only when a named
summary-only lognormal approximation is the intended model.
ForecastState exposes only index and stability. Return models compose one
validated ReturnMoments value through ReturnMomentState, keeping observation
count, representation, mean, drift, and canonical variance together while
deriving volatility. ReturnForecastStateIndicator<S> lets projections infer
the source return stream and verifies the state representation at use time.
Forecast is Num-only. Forecast.ofSamples(...) creates empirical support;
model summaries use Forecast.builder(index, horizon, numFactory, support) and
declare empirical or analytic provenance through ForecastSupport.
sampleCount() reports empirical represented values and returns zero for
analytic or unavailable forecasts. Missing direct quantiles return NaN.NaN.
At primitive-only distance or regression boundaries, bind a schema to the required representation:
ForecastFeatureExtractor<ReturnForecastState> features =
        ForecastFeatureExtractors.meanVolatility(ReturnRepresentation.LOG);
int index = series.getEndIndex();
double[] values = features.features(state.getValue(index));
// schema id: return-moments/mean-volatility; order: mean, volatility
Feature schemas publish stable identity, version, order, units, and return representation. Values remain raw; the consuming model must fit scaling only from its eligible training rows.
For a richer volatility state, the shortest path remains one constructor and the existing semantic return contract:
RoughVolatilityForecastStateIndicator roughStates =
        new RoughVolatilityForecastStateIndicator(returns);
RoughVolatilityForecastState rough = roughStates.getValue(series.getEndIndex());
The default estimator reuses EWMA return moments, estimates roughness from a 120-bar log-variogram window, measures log-volatility vol-of-vol over 60 bars, and emits cumulative variance forecasts for horizons one through five. Advanced construction can tune those windows, the horizon count, EWMA initialization, decay, and the existing EWMA drift mode. It becomes stable only when every required window is finite; an invalid return keeps it unavailable until all affected windows recover.
Use specialized roughness in analog distance only when that modeling choice is intentional:
AnalogReturnProjectionIndicator<RoughVolatilityForecastState> roughAnalog =
        AnalogReturnProjectionIndicator.builder(roughStates)
                .featureExtractor(ForecastFeatureExtractors.roughVolatility())
                .build();
// schema: [mean, volatility, roughness_hurst, vol_of_vol]
The schema remains raw and training-only standardization stays owned by the analog projection. Use rough state when volatility persistence and multi-horizon risk shape matter; prefer the smaller EWMA state when only current location and scale are needed.
For online regime uncertainty, the default constructor runs a constant-hazard Bayesian change-point filter over the same log-return source:
OnlineChangePointForecastStateIndicator changePointStates =
        new OnlineChangePointForecastStateIndicator(returns);
OnlineChangePointForecastState regime =
        changePointStates.getValue(series.getEndIndex());
The estimator becomes stable after 20 consecutive valid returns, expects a
100-observation regime, retains run lengths through 252, and reports the five
most likely hypotheses. recentChangeProbability() is the complete posterior
mass over run lengths zero through five; it is deliberately not the run-length
zero probability. That probability equals the hazard before tail truncation and
can increase slightly after truncation and renormalization, but it does not
respond usefully to a shift. A non-finite return resets the model and requires a
complete warm-up again. Each state retains recentChangeWindow() so the
probability remains interpretable after it leaves the indicator.
Advanced construction exposes model assumptions without adding a separate configuration type:
OnlineChangePointForecastStateIndicator changePointStates =
        OnlineChangePointForecastStateIndicator.builder(returns)
                .expectedRunLength(150)
                .maximumRunLength(500)
                .topRunLengthCount(8)
                .minimumObservationCount(30)
                .recentChangeWindow(10)
                .build();

AnalogReturnProjectionIndicator<OnlineChangePointForecastState> regimeAnalog =
        AnalogReturnProjectionIndicator.builder(changePointStates)
                .featureExtractor(ForecastFeatureExtractors.changePoint(
                        changePointStates.getRecentChangeWindow()))
                .build();
// schema: [mean, volatility, recent_change_probability, most_likely_run_length]
Posterior entries keep their probabilities from the complete run-length
distribution, so the published top list generally sums to less than one. The
default extractor keeps change-point/default; custom windows use
change-point/recent-change/<window> and reject mismatched state. Run length
zero retains the prior sufficient statistics; the current observation enters
growth components in the canonical Adams-MacKay recurrence. Use
change-point state when abrupt regime shifts and run-length uncertainty matter;
avoid treating it as a trade signal or performance claim without walk-forward
validation.
For a state-conditioned empirical forecast, analog projection composes directly with the same typed state source. Rolling conformal calibration then learns an error radius from matured decisions only:
AnalogReturnProjectionIndicator<ReturnForecastState> analog =
        new AnalogReturnProjectionIndicator<>(state, 5);
ReturnForecastProjectionIndicator calibrated =
        RollingConformalForecastProjectionIndicator
                .cumulativeLogReturnBuilder(analog, returns)
                .build();

Forecast analogForecast = analog.getValue(series.getEndIndex());
Forecast calibratedForecast = calibrated.getValue(series.getEndIndex());
Analog defaults use a 1-bar horizon, 252 candidate rows, 30 nearest neighbors,
at least 5 usable neighbors, Euclidean distance, [mean, volatility]
log-return features, and candidate-only standardization. The builder can tune
those choices or accept another fixed, log-return ForecastFeatureSchema.
Candidate j is never eligible before j + horizon; distance ties resolve by
the earlier source index. Candidates inside the state or return source's
unstable window are excluded. Its empirical support count is the number of
selected neighbors, not the lookback or state observation count.
Rolling conformal defaults target 90% coverage over 252 recent matured decision
rows and remain unavailable until 30 valid scores exist. A configured minimum
is raised when necessary to make the requested finite-sample rank attainable;
configurations whose rolling window can never attain that rank are rejected.
Generic value calibration observes an indicator at decision + horizon;
cumulative-log-return calibration sums the supplied log returns over the
complete horizon and preserves the semantic return-projection contract.
Calibration preserves the base mean, median, standard deviation, and support
while widening configured lower and upper quantiles. At least one configured
non-median quantile is required so a stable result always reflects calibration.
Schema or representation mismatch,
non-finite primitive conversion, insufficient history, invalid forecast
metadata, a tail-less base forecast, or a positive widening radius applied to a
zero-dispersion base forecast produces an unavailable result rather than a
misleading summary.
The runnable
ta4jexamples.analysis.forecast.RollingConformalForecastExample demonstrates
the advanced builders on the committed BTC-USD daily resource.
Forecast API migration from 0.23.0
The 0.23.1 forecast correction intentionally replaces the initial 0.23.0 surface before additional estimator families build on it:
| 0.23.0 | 0.23.1 replacement |
|---|---|
Forecast<Num> |
Num-only Forecast |
forecast.map(...) |
scale(...), affine(...), transformed samples, or a domain-specific adapter |
Forecast.ofSummary(...) |
Forecast.builder(..., ForecastSupport) |
LogReturnToPriceForecastIndicator |
Exact MonteCarloPriceForecastIndicator or explicit LognormalApproximationPriceForecastIndicator |
Return-shaped ForecastState |
Minimal ForecastState plus ReturnMomentState / ReturnMoments |
Seven-field ReturnForecastState construction |
ReturnForecastState.stable(...) or .unstable(...) |
| Unnamed feature arrays | Representation-bound ForecastFeatureSchema extractors |
This is a deliberate compatibility exception: correctness and durable model semantics take precedence over preserving the newly introduced 0.23.0 forecast signatures.
Staged exit rules
When an exit needs a thesis invalidation, a profit target, and a timeout, compose
the always-active exits with TriggeredRule stages. This keeps the immediate
stop and timeout live while a profit target can arm a second rule, such as a
trailing stop, instead of exiting immediately.
BarSeries series = ...;
ClosePriceIndicator close = new ClosePriceIndicator(series);

Rule invalidation = new StopLossRule(close, 10.0);              // touches 10% loss threshold
Rule timeout = new OpenedPositionMinimumBarCountRule(5);        // 5 bars after entry
Rule targetReached = new StopGainRule(close, 10.0);             // touch at +10%
Rule trailingExit = new TrailingStopLossRule(close, series.numFactory().numOf(5));

Rule exit = new TriggeredRule(
        invalidation.or(timeout),
        new TriggeredRule.Stage(
                targetReached,
                trailingExit,
                TriggeredRule.UNBOUNDED_WINDOW,
                false,
                TriggeredRule.ResetPolicy.ON_POSITION_CHANGE));
Use StopGainRule, StopLossRule, OverOrEqualIndicatorRule, and
UnderOrEqualIndicatorRule when a touch or beyond the boundary is enough. Use
CrossedUpIndicatorRule or CrossedDownIndicatorRule when the signal must be a
fresh cross from the previous bar.
Regime and edge primitives
Ta4j also includes reusable building blocks for regime-aware and edge-aware strategy construction, so you can model stretch, compression, trend state, and post-loss gating without burying that logic inside one custom strategy class:
ClosePriceIndicator close = new ClosePriceIndicator(series);
EMAIndicator mediumEma = new EMAIndicator(close, 20);

StretchZScoreIndicator stretch = new StretchZScoreIndicator(close, mediumEma, 20);
CompressionIndicator compression = new CompressionIndicator(series, 20, 40);
TrendScoreIndicator trendScore = new TrendScoreIndicator(series, 12, 26, 9, 14, 40);
TrendConclusionIndicator trendConclusion = new TrendConclusionIndicator(series, 20, 12, 26, 9, 14, 20, 40);

Rule cooledOffAfterLoss = new LossTriggeredCooldownRule(series, 3);

Rule entry = new UnderIndicatorRule(stretch, -1.5)
        .and(new OverIndicatorRule(compression, 70))
        .and(new OverIndicatorRule(trendScore, 15))
        .and(cooledOffAfterLoss);
If you already have a boolean signal source, EntryEdgeIndicator,
EdgeDecaySlopeIndicator, and EdgeHealthyRule let you score that signal's
realized edge over a rolling horizon and turn it into a reusable entry gate.
Sourcing market data
New to trading and not sure where to get historical price data? You're not alone! Ta4j makes it easy to get started with real market data using the unified BarSeriesDataSource interface. All data sources work with the same domain-driven API using business concepts like ticker symbols, intervals, and date ranges.
Quick solution: Yahoo Finance (no API key required)
The easiest way to get started is using the built-in YahooFinanceHttpBarSeriesDataSource from ta4j-examples. It fetches real market data from Yahoo Finance's public API - no registration or API key needed.
Using the unified interface (recommended):
import ta4jexamples.datasources.YahooFinanceHttpBarSeriesDataSource;
import java.time.Duration;
import java.time.Instant;

// Enable response caching to avoid hitting API limits during development
YahooFinanceHttpBarSeriesDataSource dataSource = new YahooFinanceHttpBarSeriesDataSource(true);

// Load data using the unified interface (works with any data source)
BarSeries series = dataSource.loadSeries("AAPL",
    Duration.ofDays(1),  // Daily bars
    Instant.parse("2023-01-01T00:00:00Z"),
    Instant.parse("2023-12-31T23:59:59Z"));
Using convenience methods:
// Load by bar count (e.g., 2 years of daily candles)
BarSeries series = dataSource.loadSeriesInstance("AAPL",
    YahooFinanceHttpBarSeriesDataSource.YahooFinanceInterval.DAY_1, 730);

// Or use static convenience methods
BarSeries series = YahooFinanceHttpBarSeriesDataSource.loadSeries("AAPL", 365); // 1 year of daily data
BarSeries series = YahooFinanceHttpBarSeriesDataSource.loadSeries("BTC-USD",
    YahooFinanceHttpBarSeriesDataSource.YahooFinanceInterval.HOUR_1, 500); // 500 hourly bars
Supported assets:
- Stocks:
"AAPL","MSFT","GOOGL","TSLA", etc. - ETFs:
"SPY","QQQ","VTI", etc. - Cryptocurrencies:
"BTC-USD","ETH-USD","SOL-USD", etc.
Supported intervals:
- Intraday:
MINUTE_1,MINUTE_5,MINUTE_15,MINUTE_30,HOUR_1,HOUR_4 - Daily/weekly/monthly:
DAY_1,WEEK_1,MONTH_1
💡 Tip: Enable caching (new YahooFinanceHttpBarSeriesDataSource(true)) to cache API responses locally. This speeds up development and reduces API calls. Cached data is automatically reused for the same requests.
See it in action: Run the complete example with:
./mvnw -pl ta4j-examples exec:java -Dexec.mainClass=ta4jexamples.backtesting.YahooFinanceBacktest
This example demonstrates loading data from Yahoo Finance, building an advanced multi-indicator strategy (Bollinger Bands, RSI, ATR stops), running a backtest, and visualizing results.
Coinbase (cryptocurrency data)
For cryptocurrency data, use CoinbaseHttpBarSeriesDataSource which fetches data from Coinbase's public market data API. No authentication required.
import ta4jexamples.datasources.CoinbaseHttpBarSeriesDataSource;
import java.time.Duration;
import java.time.Instant;

// Enable response caching
CoinbaseHttpBarSeriesDataSource dataSource = new CoinbaseHttpBarSeriesDataSource(true);

// Using the unified interface
BarSeries series = dataSource.loadSeries("BTC-USD",
    Duration.ofDays(1),
    Instant.parse("2023-01-01T00:00:00Z"),
    Instant.parse("2023-12-31T23:59:59Z"));

// Or use convenience methods
BarSeries series = CoinbaseHttpBarSeriesDataSource.loadSeries("BTC-USD", 365); // 1 year of daily data
BarSeries series = dataSource.loadSeriesInstance("ETH-USD",
    CoinbaseHttpBarSeriesDataSource.CoinbaseInterval.ONE_HOUR, 500); // 500 hourly bars
Supported trading pairs: All Coinbase trading pairs (e.g., "BTC-USD", "ETH-USD", "SOL-USD")
API limits: Coinbase API has a maximum of 350 candles per request. The implementation automatically paginates large requests into multiple API calls and merges the results.
See it in action: Run the complete example with:
./mvnw -pl ta4j-examples exec:java -Dexec.mainClass=ta4jexamples.backtesting.CoinbaseBacktest
Other data sources
Ta4j works with any OHLCV (Open, High, Low, Close, Volume) data. The ta4j-examples module includes implementations for several data sources, all using the unified BarSeriesDataSource interface:
- YahooFinanceHttpBarSeriesDataSource - Fetch live data from Yahoo Finance API (stocks, ETFs, crypto) with optional response caching
- CoinbaseHttpBarSeriesDataSource - Load historical crypto data from Coinbase's public API with automatic caching and pagination
- CsvFileBarSeriesDataSource - Load OHLCV data from CSV files with intelligent filename pattern matching
- JsonFileBarSeriesDataSource - Load Coinbase/Binance-style JSON bar data with flexible date filtering
- BitStampCsvTradesFileBarSeriesDataSource - Aggregate Bitstamp trade-level CSV data into bars on-the-fly
All data sources share the same interface:
BarSeriesDataSource yahoo = new YahooFinanceHttpBarSeriesDataSource(true);
BarSeriesDataSource coinbase = new CoinbaseHttpBarSeriesDataSource(true);
BarSeriesDataSource csv = new CsvFileBarSeriesDataSource();

// Same interface, different implementations
BarSeries aapl = yahoo.loadSeries("AAPL", Duration.ofDays(1), start, end);
BarSeries btc = coinbase.loadSeries("BTC-USD", Duration.ofDays(1), start, end);
BarSeries eth = csv.loadSeries("ETH-USD", Duration.ofDays(1), start, end);
Create your own data source: Simply implement the BarSeriesDataSource interface. You can load data from:
- CSV files
- REST APIs (your broker, exchange, or data provider)
- Databases (SQL, NoSQL)
- WebSocket streams (for live data)
- Any other source you prefer
See the Data Loading Examples section for more details.
Evaluate performance with metrics
Turn ideas into numbers. Add trading costs for realism and measure what matters: returns, risk, drawdowns, and more.
import org.ta4j.core.criteria.pnl.NetReturnCriterion;
import org.ta4j.core.criteria.drawdown.MaximumDrawdownCriterion;
import org.ta4j.core.analysis.cost.LinearBorrowingCostModel;
import org.ta4j.core.analysis.cost.LinearTransactionCostModel;

// Run backtest with realistic trading costs
// Transaction cost: 0.1% per trade (typical for crypto exchanges)
// Borrowing cost: 0.01% per period (for margin/short positions)
TradingRecord record = new BarSeriesManager(series,
        new LinearTransactionCostModel(0.001),      // 0.1% fee per trade
        new LinearBorrowingCostModel(0.0001))       // 0.01% borrowing cost
        .run(strategy);

// Leveraged-long assumptions can opt in explicitly:
// new LinearBorrowingCostModel(0.0001, LinearBorrowingCostModel.Applicability.BOTH)

// Calculate performance metrics
System.out.printf("Trades executed: %d%n", record.getTradeCount());
System.out.printf("Net return: %.2f%%%n",
    new NetReturnCriterion().calculate(series, record).multipliedBy(series.numOf(100)));
System.out.printf("Max drawdown: %.2f%%%n",
    new MaximumDrawdownCriterion().calculate(series, record).multipliedBy(series.numOf(100)));

// Explore more metrics: Sharpe ratio, win rate, profit factor, etc.
// See the wiki for the full list of available criteria
You can also swap in execution models that simulate slippage and order-book-style fills:
import org.ta4j.core.backtest.SlippageExecutionModel;
import org.ta4j.core.backtest.StopLimitExecutionModel;

// Example 1: next-open execution with 5 bps slippage
TradingRecord slippageRecord = new BarSeriesManager(series,
        new SlippageExecutionModel(series.numFactory().numOf(0.0005)))
        .run(strategy);

// Example 2: stop-limit orders with partial fills (max 25% bar-volume participation)
TradingRecord stopLimitRecord = new BarSeriesManager(series,
        new StopLimitExecutionModel(
                series.numFactory().numOf(0.003),  // stop trigger ratio
                series.numFactory().numOf(0.004),  // limit offset ratio
                series.numFactory().numOf(0.25),   // max bar participation
                4))                                // order TTL in bars
        .run(strategy, strategy.getStartingType(), series.numFactory().numOf(10));
Want a runnable side-by-side demo? ta4j-examples now includes
TradingRecordParityBacktest, which compares next-open, current-close, and
slippage fills on the same strategy and then shows the same setup with provided
and factory-configured BaseTradingRecord flows.
Analyze indicator relationships
For structural price analysis, choose the detector by turn shape. OHLC-aware
ZigZag detection confirms sharp reversals after a price-distance threshold;
fractal detection confirms local extrema after a fixed right-side window; and
SlopeChangeSwingDetector confirms slower, rounded turns after a sustained
rolling-slope reversal. SwingDetectors.consensus(...) can require a quorum
of nearby pivots from several configurations when consistency matters more than
the earliest possible confirmation. All returned detector pivots are based only
on bars available at the requested index.
SwingDetector roundedTurns = SwingDetectors.slopeChange(5);
SwingDetector stableStructure = SwingDetectors.consensus(2, 2,
        SwingDetectors.fractal(3), roundedTurns);
For sparse event studies, start with a windowed event-synchronization score: compare events such as Net Momentum zero crossings against newly confirmed ZigZag swing highs or lows inside a tolerance window. After the event timing is credible, use rolling statistics to inspect continuous, lagged, non-linear, or regime-conditioned relationships.
import org.ta4j.core.Indicator;
import org.ta4j.core.indicators.NetMomentumIndicator;
import org.ta4j.core.indicators.RSIIndicator;
import org.ta4j.core.indicators.helpers.BooleanTransformIndicator;
import org.ta4j.core.indicators.helpers.ClosePriceIndicator;
import org.ta4j.core.indicators.statistics.LaggedCorrelationIndicator;
import org.ta4j.core.indicators.statistics.MutualInformationIndicator;
import org.ta4j.core.indicators.statistics.RegimeSegmentedCorrelationIndicator;
import org.ta4j.core.indicators.statistics.SpearmanRankCorrelationIndicator;
import org.ta4j.core.indicators.zigzag.RecentZigZagSwingHighIndicator;

ClosePriceIndicator close = new ClosePriceIndicator(series);
RSIIndicator rsi = new RSIIndicator(close, 14);
NetMomentumIndicator momentum = NetMomentumIndicator.forRsiWithDecay(rsi, 20, 0.85);
RecentZigZagSwingHighIndicator swingHigh = new RecentZigZagSwingHighIndicator(series);

Indicator<Boolean> positiveMomentum = BooleanTransformIndicator.isPositive(momentum);
Indicator<Boolean> confirmedSwingHigh = new BooleanTransformIndicator<>(swingHigh, value -> !value.isNaN());

LaggedCorrelationIndicator momentumLeadsPrice = new LaggedCorrelationIndicator(momentum, close, 50, 3);
SpearmanRankCorrelationIndicator monotonicMomentumPrice = new SpearmanRankCorrelationIndicator(momentum, close, 50);
RegimeSegmentedCorrelationIndicator bullishRegimeCorrelation =
        new RegimeSegmentedCorrelationIndicator(momentum, close, positiveMomentum, 50);
MutualInformationIndicator swingStateInformation = new MutualInformationIndicator(momentum, swingHigh, 80, 6);
RegimeSegmentedCorrelationIndicator confirmedSwingCorrelation =
        new RegimeSegmentedCorrelationIndicator(momentum, close, confirmedSwingHigh, 80);
Backtest hundreds or even thousands of strategies
Want to find the top performers? Generate strategies with varying parameters and compare them:
// Generate strategies with varying parameters
List<Strategy> strategies = new ArrayList<>();
for (int fastPeriod = 5; fastPeriod <= 20; fastPeriod += 5) {
    for (int slowPeriod = 20; slowPeriod <= 50; slowPeriod += 10) {
        EMAIndicator fastEma = new EMAIndicator(close, fastPeriod);
        EMAIndicator slowEma = new EMAIndicator(close, slowPeriod);
        Rule entry = new CrossedUpIndicatorRule(fastEma, slowEma);
        Rule exit = new CrossedDownIndicatorRule(fastEma, slowEma);
        strategies.add(new BaseStrategy("EMA(" + fastPeriod + "," + slowPeriod + ")", entry, exit));
    }
}

// Run all strategies with progress tracking
BacktestExecutionResult result = new BacktestExecutor(series)
    .executeWithRuntimeReport(strategies,
        series.numFactory().numOf(1),  // position size: 1 unit
        Trade.TradeType.BUY,           // long positions (use Trade.TradeType.SELL for shorts)
        ProgressCompletion.loggingWithMemory()); // logs progress with memory stats

// Or size each entry dynamically. PositionSizer.fixed() is the default unit
// amount; balance(...) invests the current realized balance with entry-fee
// awareness; and kelly(...) applies the Kelly fraction to that balance.
// For custom TradeExecutionModel implementations, dynamic sizing uses:
// (1) estimateEntryTarget(...) to estimate where/at what price the entry would fill
// (2) a fallback to conservative next-open estimation when no custom override is provided
//     for that model.
// Custom models should override estimateEntryTarget(...) when execution timing or price
// differs from next-open behavior.
PositionSizer unitAmount = PositionSizer.fixed();
PositionSizer allInBalance = PositionSizer.balance(10_000);
PositionSizer halfKelly = PositionSizer.kelly(10_000, 0.55, 1.8, 0.5);
PositionSizer quarterBalance = PositionSizer.balance(10_000,
    (context, balance) -> context.maxAffordableAmount(balance.multipliedBy(context.numOf(0.25))));

BacktestExecutionResult dynamicallySizedResult = new BacktestExecutor(series)
    .executeWithRuntimeReport(strategies, allInBalance, Trade.TradeType.BUY);

// The same sizer works with top-K and walk-forward execution. It sizes
// entries; exits close the currently open amount.
// Reused PositionSizer instances should be stateless or thread-safe because
// executor and top-K variants can evaluate strategies in parallel.

// Weight net profit at 70% and return over max drawdown at 30%.
// Weights are normalized internally, so 7/3 and 0.7/0.3 are equivalent.
AnalysisCriterion netProfitCriterion = new NetProfitCriterion();
AnalysisCriterion returnOverMaxDrawdownCriterion = new ReturnOverMaxDrawdownCriterion();

// Get the top 10 strategies by composite weighted score
List<TradingStatement> topStrategies = result.getTopStrategiesWeighted(10,
    WeightedCriterion.of(netProfitCriterion, 7.0),
    WeightedCriterion.of(returnOverMaxDrawdownCriterion, 3.0));

// Review the winners
topStrategies.forEach(statement -> {
    System.out.printf("Strategy: %s, Net Profit: %s, Return over Max Drawdown: %s%n",
        statement.getStrategy().getName(),
        statement.getCriterionScore(netProfitCriterion).orElse(series.numOf(0)),
        statement.getCriterionScore(returnOverMaxDrawdownCriterion).orElse(series.numOf(0)));
});
It’s not uncommon for a first backtest to look promising. Very promising. Resist the urge to extrapolate annualized returns, quit your job, or price out yachts.
Visualize and share strategies
See your strategies in action. Ta4j includes charting helpers, but you're not locked in - serialize to JSON and use any visualization stack you prefer.
Built-in Java charting (using JFreeChart):
Basic strategy visualization with indicator overlays:
// Generate simplified chart - just price, indicators, and signals (no subchart)
ChartWorkflow chartWorkflow = new ChartWorkflow();
JFreeChart chart = chartWorkflow.builder()
        .withTitle("EMA Crossover Strategy")
        .withTimeAxisMode(TimeAxisMode.BAR_INDEX) // Optional: compress non-trading gaps (weekends/holidays)
        .withSeries(series) // Price bars (candlesticks)
        .withIndicatorOverlay(fastEma) // Overlay indicators on price chart
        .withIndicatorOverlay(slowEma)
        .withTradingRecordOverlay(record) // Mark entry/exit points with arrows
        .toChart();
chartWorkflow.saveChartImage(chart, series, "ema-crossover-strategy", "output/charts"); // Save as image
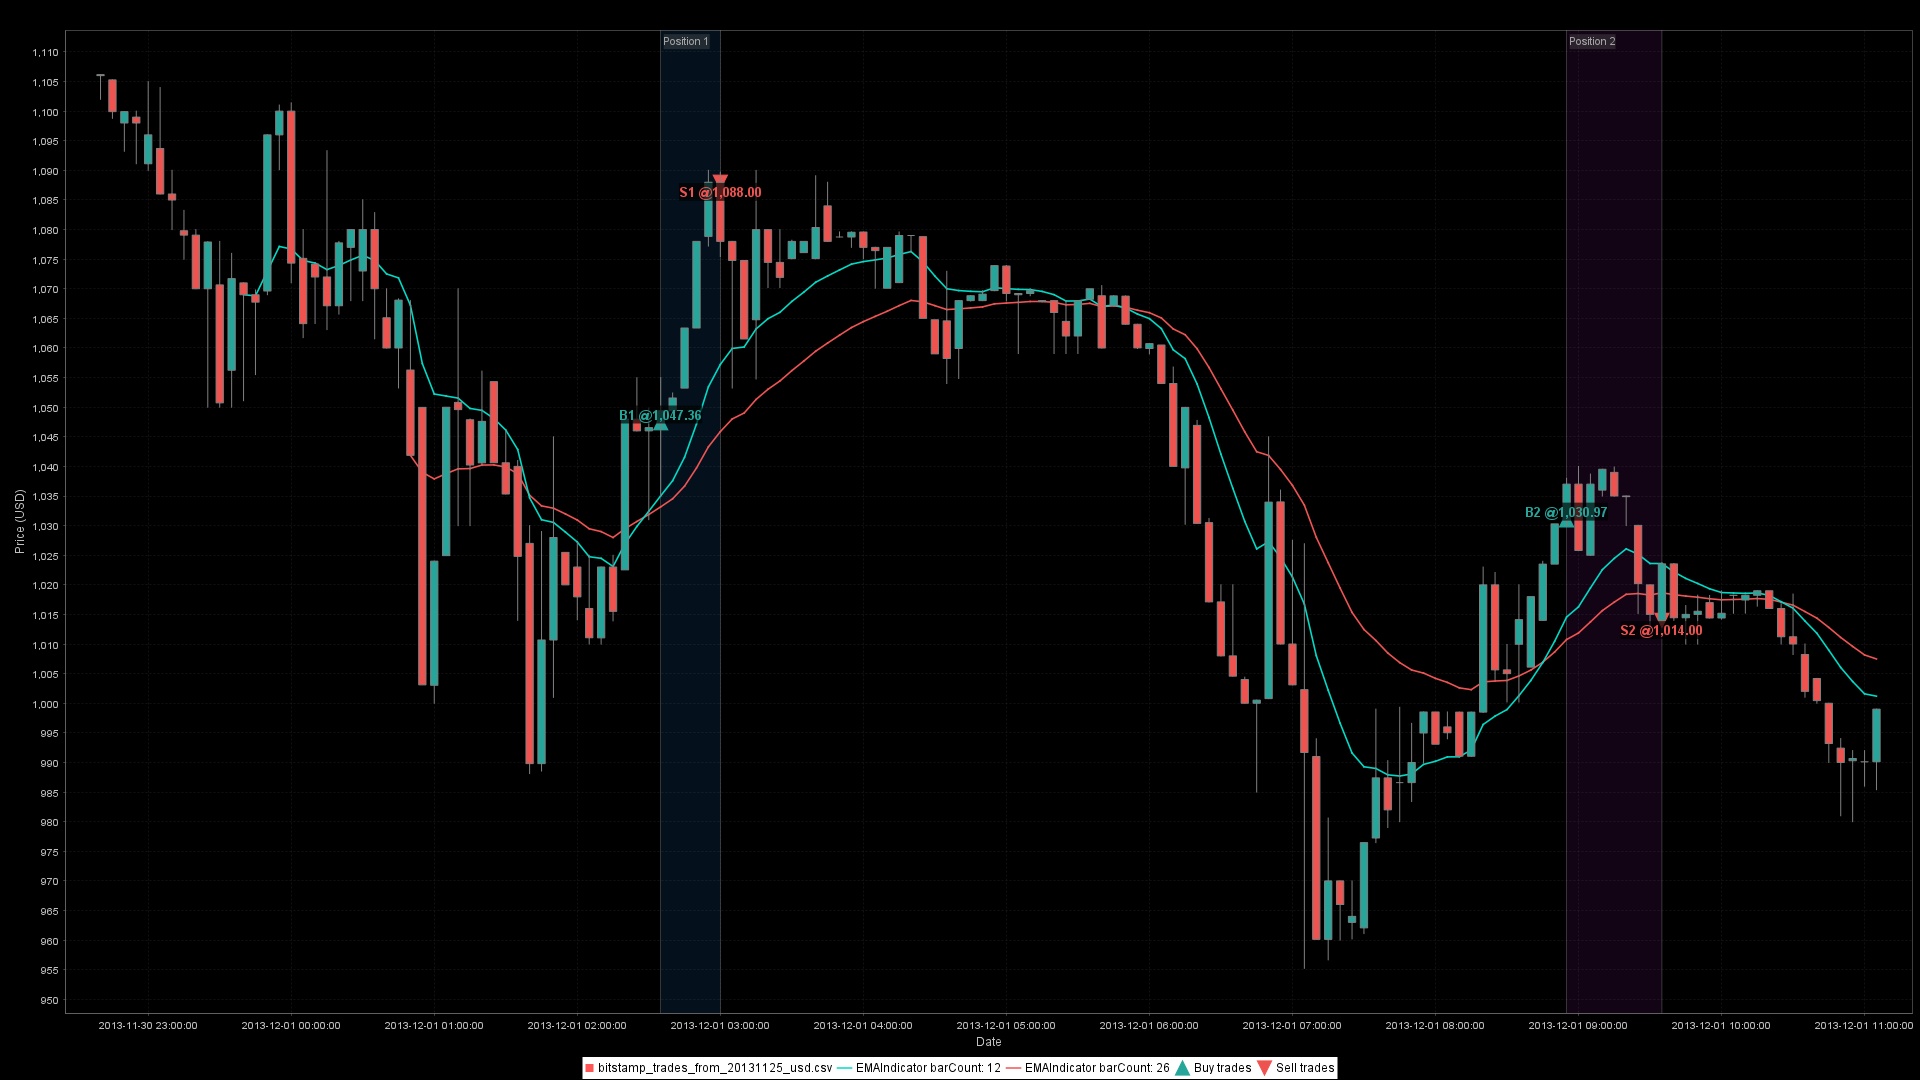
The chart above shows candlestick price data with EMA lines overlaid and buy/sell signals marked with arrows. This demonstrates basic strategy visualization with indicator overlays.
Use TimeAxisMode.BAR_INDEX when you want to remove visual gaps from weekends or market holidays while keeping the underlying bar timestamps intact.
If you need to inspect or customize a chart before rendering, call toPlan() and review plan.context()/plan.metadata() for the shared title, domain series, and time axis mode. The same metadata drives consistent title styling across chart types when you render or save charts.
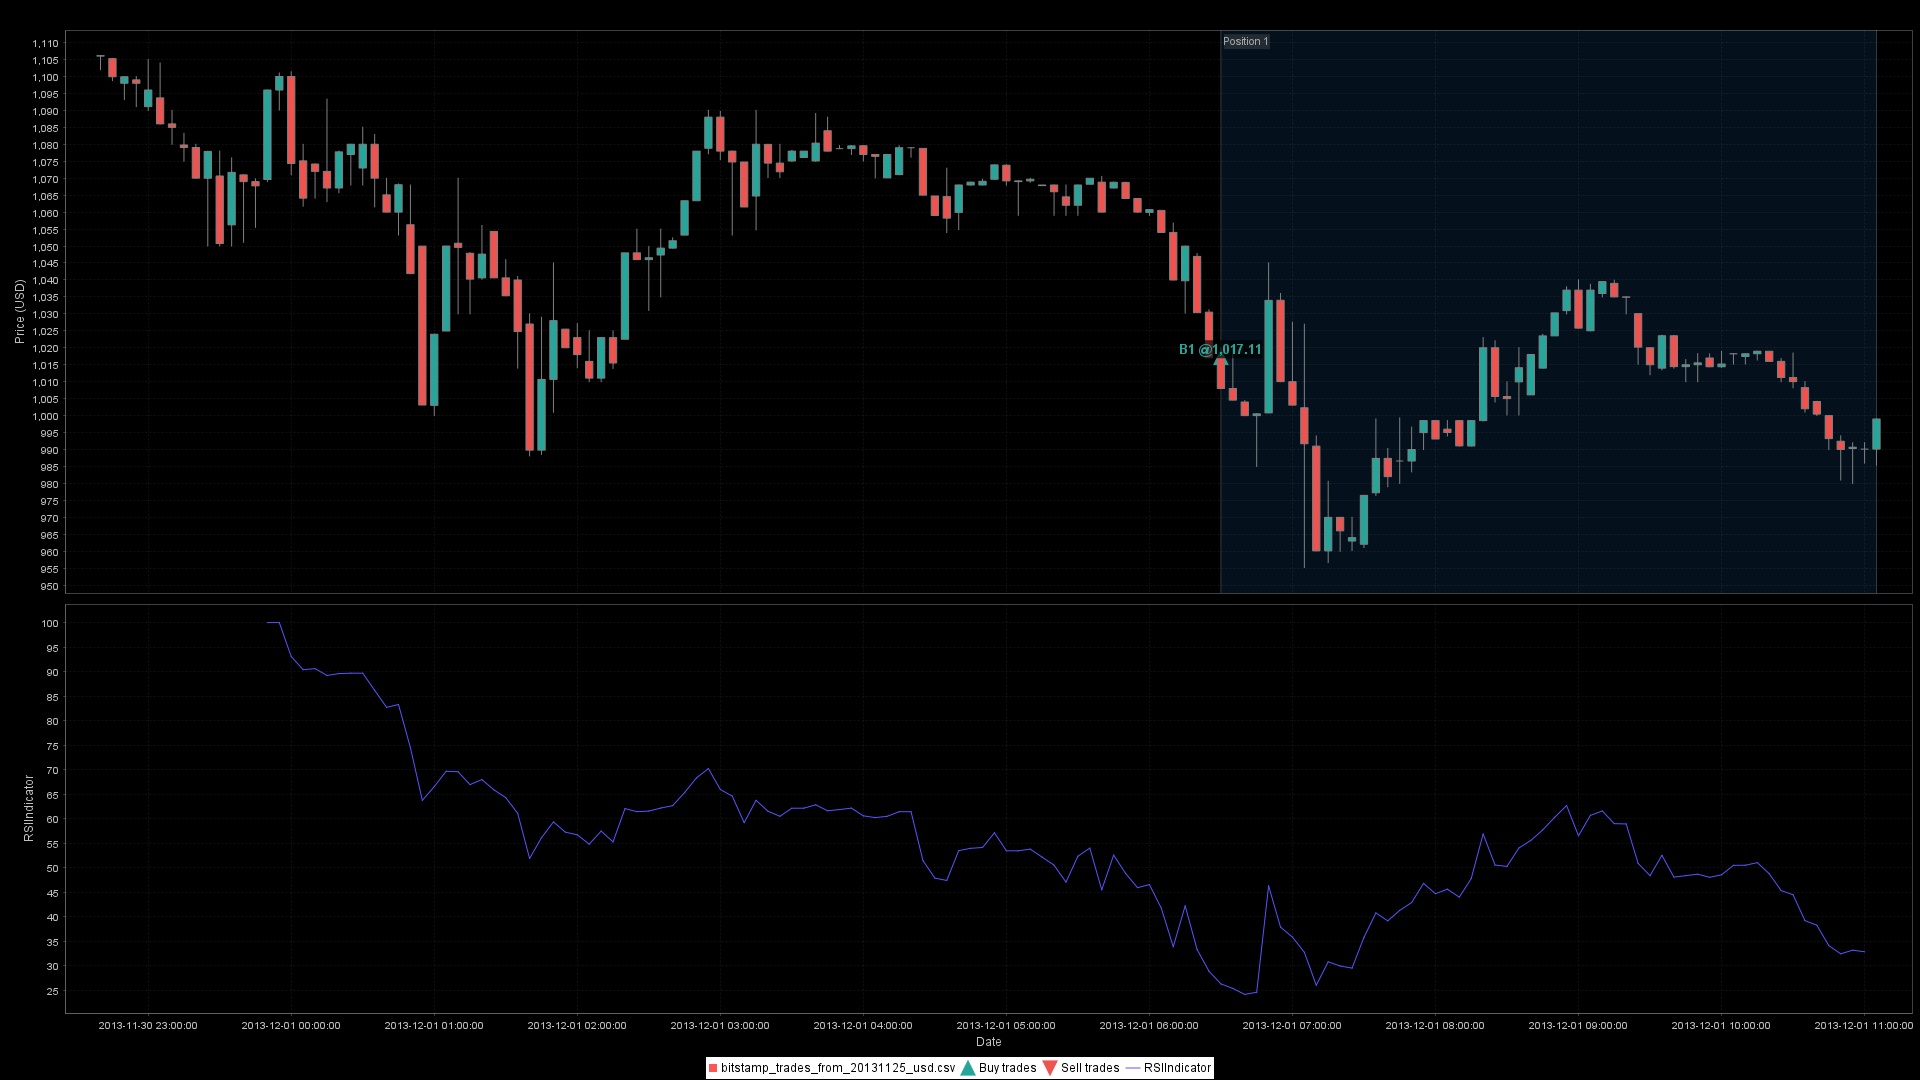
Adding indicator subcharts for indicators with different scales (like RSI, which ranges from 0-100):
// Create indicators
ClosePriceIndicator close = new ClosePriceIndicator(series);
RSIIndicator rsi = new RSIIndicator(close, 14);

// RSI strategy: buy when RSI crosses below 30 (oversold), sell when RSI crosses
// above 70 (overbought)
Rule entry = new CrossedDownIndicatorRule(rsi, 30);
Rule exit = new CrossedUpIndicatorRule(rsi, 70);
Strategy strategy = new BaseStrategy("RSI Strategy", entry, exit);
TradingRecord record = new BarSeriesManager(series).run(strategy);

ChartWorkflow chartWorkflow = new ChartWorkflow();
JFreeChart chart = chartWorkflow.builder()
        .withTitle("RSI Strategy with Subchart")
        .withSeries(series) // Price bars (candlesticks)
        .withTradingRecordOverlay(record) // Mark entry/exit points
        .withSubChart(rsi) // RSI indicator in separate subchart panel
        .toChart();
Visualizing performance metrics alongside your strategy:
// Create indicators: multiple moving averages
ClosePriceIndicator close = new ClosePriceIndicator(series);
SMAIndicator sma20 = new SMAIndicator(close, 20);
EMAIndicator ema12 = new EMAIndicator(close, 12);

// Strategy: buy when EMA crosses above SMA, sell when EMA crosses below SMA
Rule entry = new CrossedUpIndicatorRule(ema12, sma20);
Rule exit = new CrossedDownIndicatorRule(ema12, sma20);
Strategy strategy = new BaseStrategy("EMA/SMA Crossover", entry, exit);
TradingRecord record = new BarSeriesManager(series).run(strategy);

ChartWorkflow chartWorkflow = new ChartWorkflow();
JFreeChart chart = chartWorkflow.builder()
        .withTitle("Strategy Performance Analysis")
        .withSeries(series) // Price bars (candlesticks)
        .withIndicatorOverlay(sma20) // Overlay SMA on price chart
        .withIndicatorOverlay(ema12) // Overlay EMA on price chart
        .withTradingRecordOverlay(record) // Mark entry/exit points
        .withSubChart(new MaximumDrawdownCriterion(), record) // Performance metric in subchart
        .toChart();
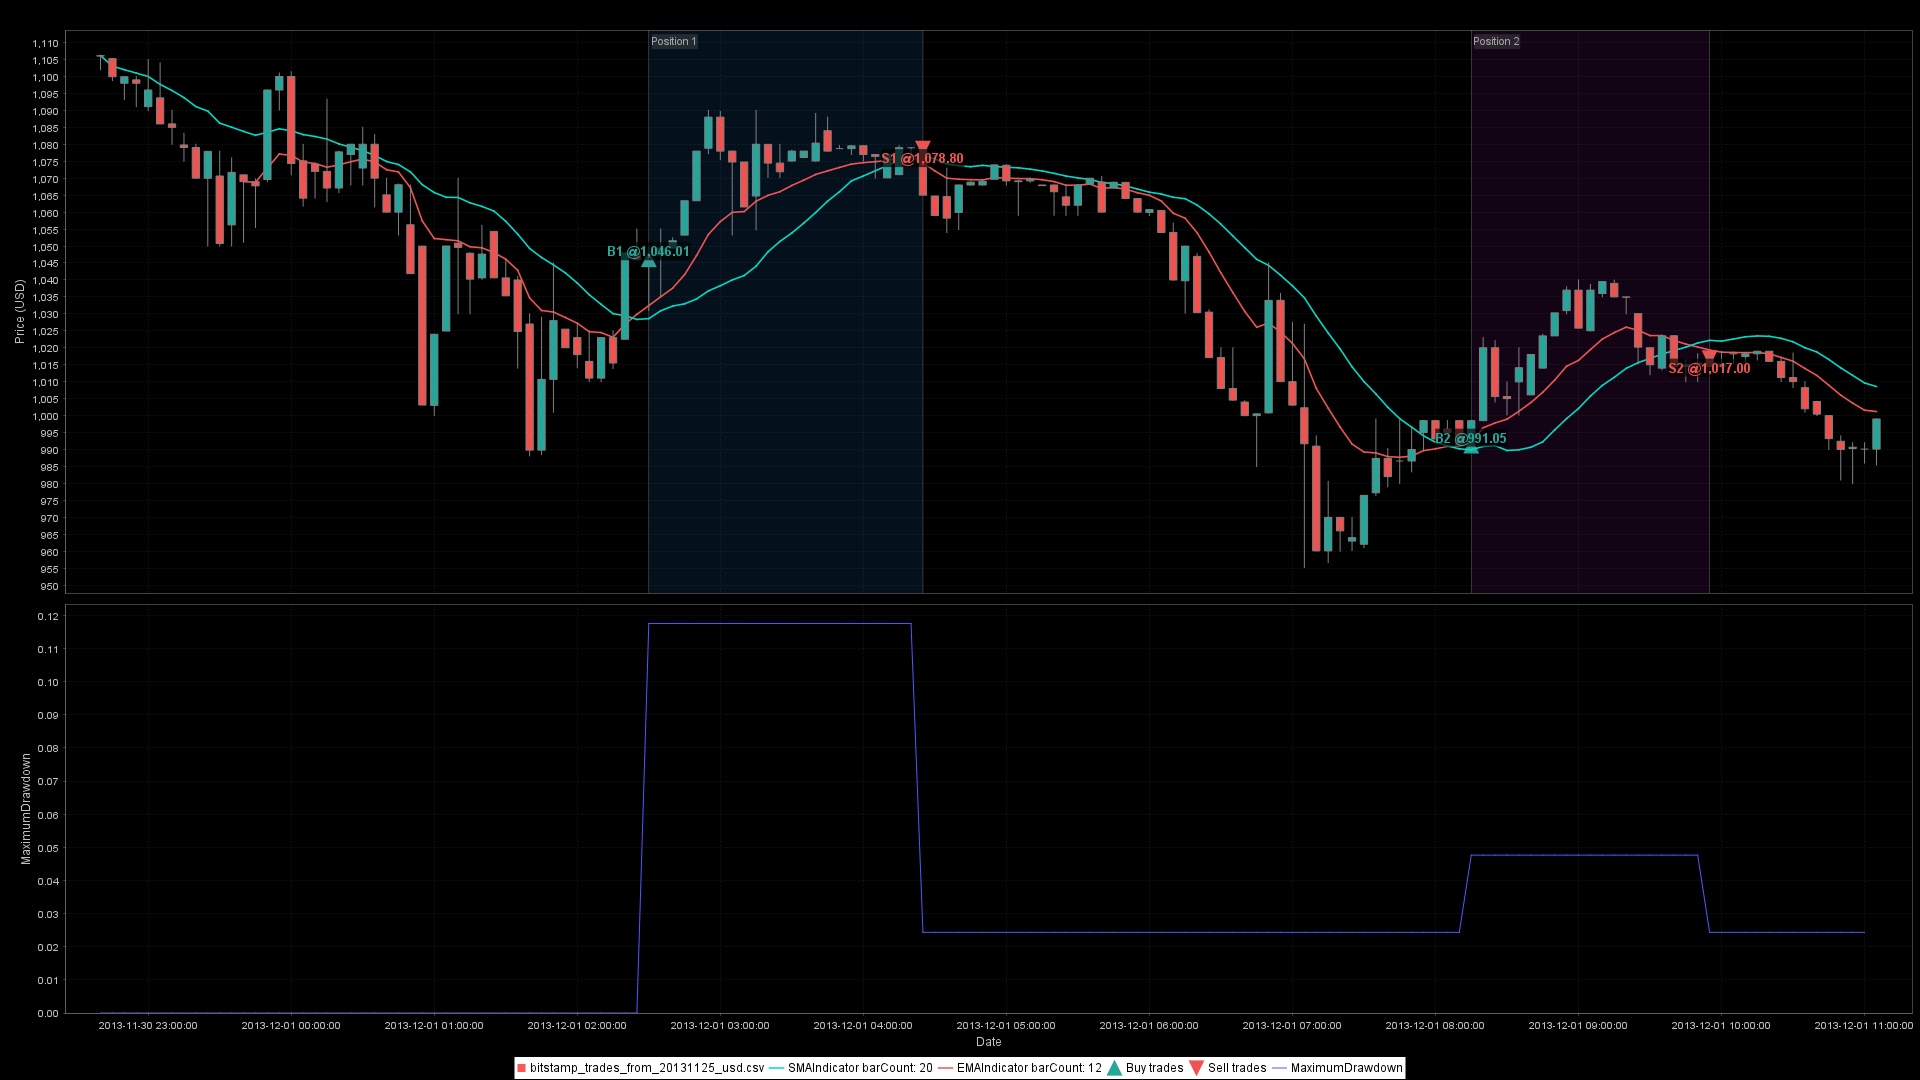
This chart shows price action with indicator overlays, trading signals, and a performance subchart displaying maximum drawdown over time - helping you understand risk alongside returns.
Advanced multi-indicator analysis with multiple subcharts:
// Create indicators
ClosePriceIndicator close = new ClosePriceIndicator(series);
SMAIndicator sma50 = new SMAIndicator(close, 50);
EMAIndicator ema12 = new EMAIndicator(close, 12);
MACDIndicator macd = new MACDIndicator(close, 12, 26);
RSIIndicator rsi = new RSIIndicator(close, 14);

// Strategy: buy when EMA crosses above SMA and RSI > 50, sell when EMA crosses
// below SMA
Rule entry = new CrossedUpIndicatorRule(ema12, sma50).and(new OverIndicatorRule(rsi, 50));
Rule exit = new CrossedDownIndicatorRule(ema12, sma50);
Strategy strategy = new BaseStrategy("Advanced Multi-Indicator Strategy", entry, exit);
TradingRecord record = new BarSeriesManager(series).run(strategy);

ChartWorkflow chartWorkflow = new ChartWorkflow();
JFreeChart chart = chartWorkflow.builder()
        .withTitle("Advanced Multi-Indicator Strategy")
        .withSeries(series) // Price bars (candlesticks)
        .withIndicatorOverlay(sma50) // Overlay SMA on price chart
        .withIndicatorOverlay(ema12) // Overlay EMA on price chart
        .withTradingRecordOverlay(record) // Mark entry/exit points
        .withSubChart(macd) // MACD indicator in subchart
        .withSubChart(rsi) // RSI indicator in subchart
        .withSubChart(new NetProfitLossCriterion(), record) // Net profit/loss performance metric
        .toChart();
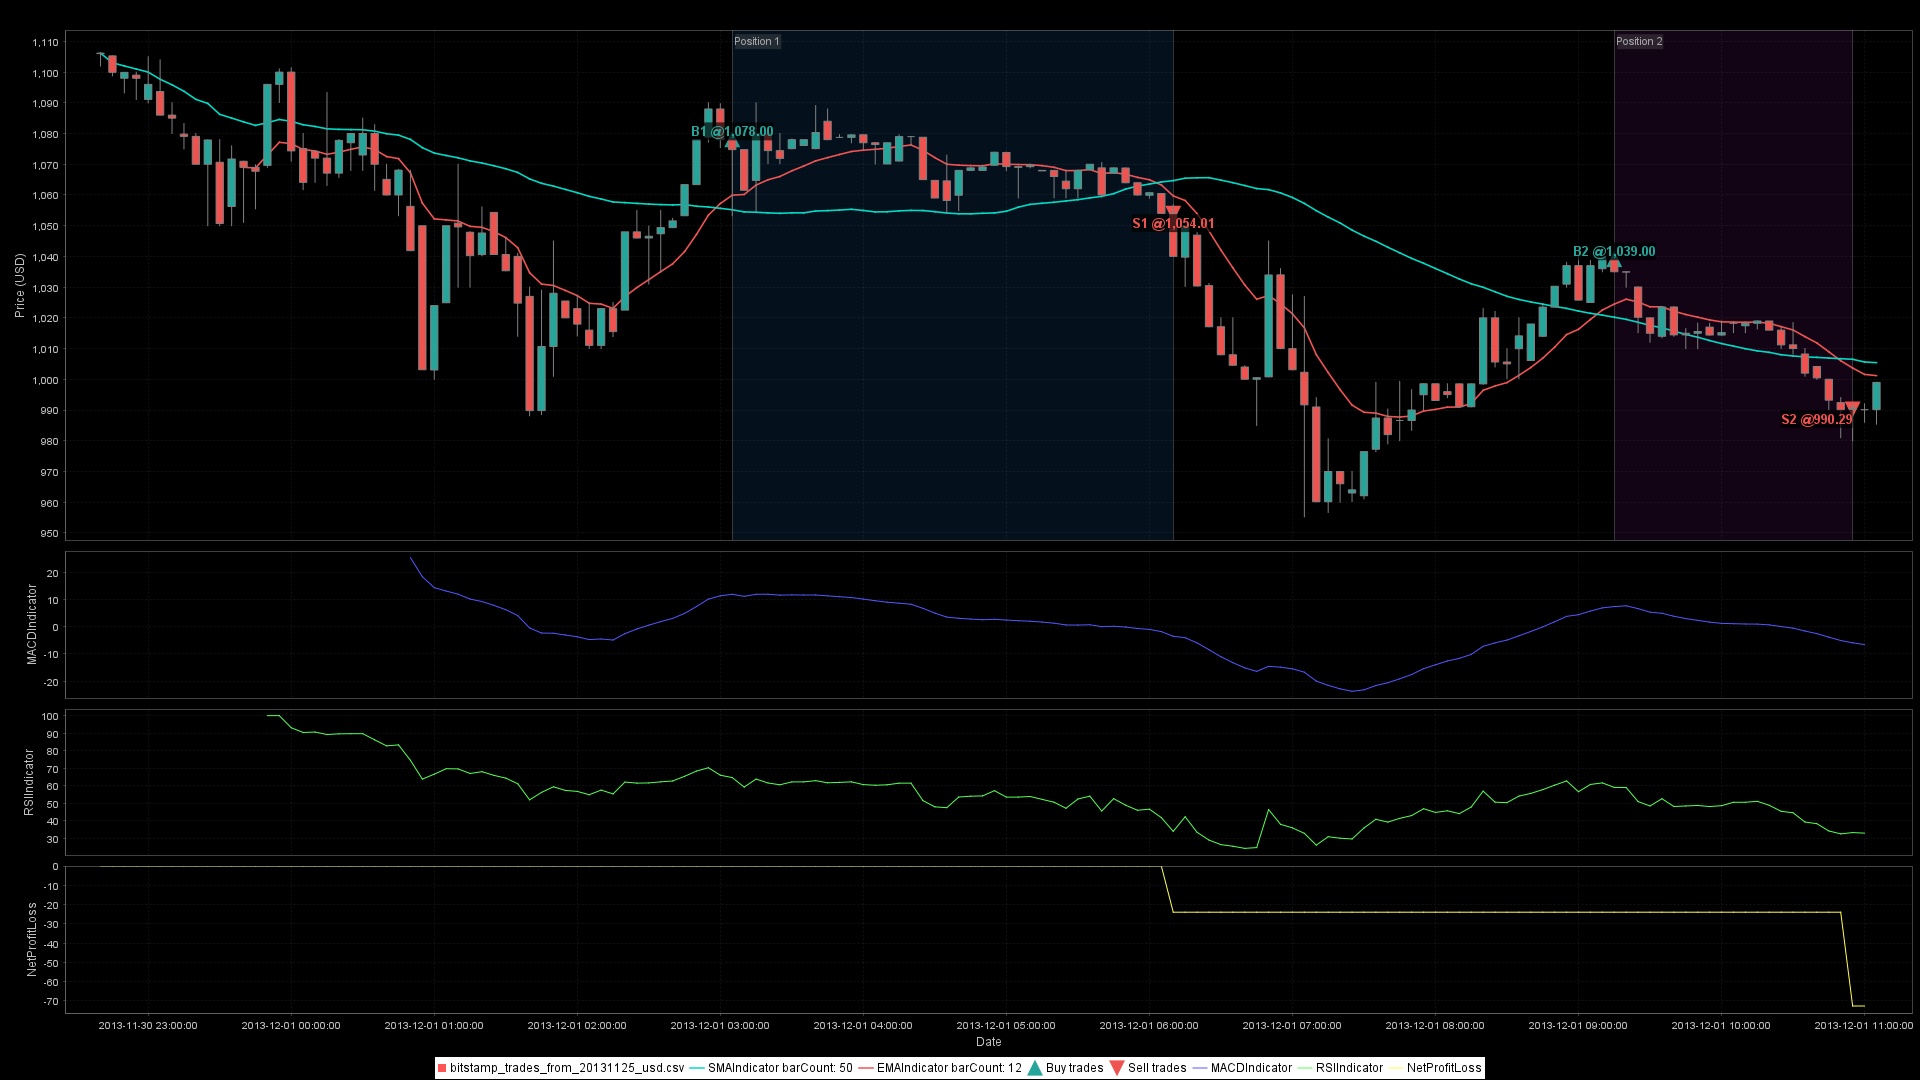
This comprehensive chart demonstrates combining multiple indicators (MACD, RSI) in separate subcharts with performance metrics, giving you a complete view of strategy behavior.
See the chart at the top of this README for another example, or check the wiki's charting guide for more examples.
Export to any stack (Python, TypeScript, etc.):
Serialize indicators, rules, and strategies to JSON for persistence, sharing, or integration with other systems:
// Serialize an indicator (RSI) to JSON
ClosePriceIndicator close = new ClosePriceIndicator(series);
RSIIndicator rsi = new RSIIndicator(close, 14);
String rsiJson = rsi.toJson();
LOG.info("Output: {}", rsiJson);
// Output:
// {"type":"RSIIndicator","parameters":{"barCount":14},"components":[{"type":"ClosePriceIndicator"}]}
// Serialize a rule (AndRule) to JSON
Rule rule1 = new OverIndicatorRule(rsi, 50);
Rule rule2 = new UnderIndicatorRule(rsi, 80);
Rule andRule = new AndRule(rule1, rule2);
String ruleJson = ComponentSerialization.toJson(RuleSerialization.describe(andRule));
LOG.info("Output: {}", ruleJson);
// Output:
// {"type":"AndRule","label":"AndRule","components":[{"type":"OverIndicatorRule","label":"OverIndicatorRule","components":[{"type":"RSIIndicator","parameters":{"barCount":14},"components":[{"type":"ClosePriceIndicator"}]}],"parameters":{"threshold":50.0}},{"type":"UnderIndicatorRule","label":"UnderIndicatorRule","components":[{"type":"RSIIndicator","parameters":{"barCount":14},"components":[{"type":"ClosePriceIndicator"}]}],"parameters":{"threshold":80.0}}]}
// Serialize a strategy (EMA Crossover) to JSON
EMAIndicator fastEma = new EMAIndicator(close, 12);
EMAIndicator slowEma = new EMAIndicator(close, 26);
Rule entry = new CrossedUpIndicatorRule(fastEma, slowEma);
Rule exit = new CrossedDownIndicatorRule(fastEma, slowEma);
Strategy strategy = new BaseStrategy("EMA Crossover", entry, exit);
String strategyJson = strategy.toJson();
LOG.info("Output: {}", strategyJson);
// Output: {"type":"BaseStrategy","label":"EMA
// Crossover","parameters":{"unstableBars":0},"rules":[{"type":"CrossedUpIndicatorRule","label":"entry","components":[{"type":"EMAIndicator","parameters":{"barCount":12},"components":[{"type":"ClosePriceIndicator"}]},{"type":"EMAIndicator","parameters":{"barCount":26},"components":[{"type":"ClosePriceIndicator"}]}]},{"type":"CrossedDownIndicatorRule","label":"exit","components":[{"type":"EMAIndicator","parameters":{"barCount":12},"components":[{"type":"ClosePriceIndicator"}]},{"type":"EMAIndicator","parameters":{"barCount":26},"components":[{"type":"ClosePriceIndicator"}]}]}]}
Restore from JSON:
// Restore indicators and strategies from JSON
Indicator<?> restoredIndicator = Indicator.fromJson(series, rsiJson);
Strategy restoredStrategy = Strategy.fromJson(series, strategyJson);
Author concise strategy JSON with the opt-in version: 2 envelope:
String v2StrategyJson = """
        {
          "version": 2,
          "name": "Momentum_Crossover",
          "entryRule": { "type": "CrossedUpIndicatorRule", "args": ["SMA(12)", "SMA(26)"] },
          "exitRule": {
            "type": "OrRule",
            "rules": [
              { "type": "StopLossRule", "args": ["2.5%"] },
              { "type": "CrossedDownIndicatorRule", "args": ["SMA(12)", "SMA(26)"] }
            ]
          }
        }
        """;
Strategy conciseStrategy = Strategy.fromJson(series, v2StrategyJson);
String canonicalJson = conciseStrategy.toJson(); // emits the canonical descriptor/v1 form
Strategy JSON v2 also accepts named shorthand strings for rules and a compact top-level strategy macro:
String compactStrategyJson = """
        {
          "version": 2,
          "strategy": "SMA(7,21)",
          "name": "Daily_SMA_Crossover"
        }
        """;
Strategy strategy = Strategy.fromJson(series, compactStrategyJson);
String compactJson = strategy.toCompactJson(); // optional v2 output; toJson() stays canonical

Strategy macroStrategy = Strategy.fromExpression(series, "SMA(7,21)");
String strategyExpression = macroStrategy.toExpression(); // "SMA(7,21)"
Named shorthand is kind-specific. SMA(7) is a single indicator over close
price, while strategy-level SMA(7,21) expands to an SMA crossover strategy.
Rule-level direction stays explicit with SmaCrossUp(7,21),
SmaCrossDown(7,21), or generic forms such as
CrossedUp(SMA(7),SMA(21)).
The shorthand grammar is deliberately bounded and strict:
| JSON area | Accepted values |
|---|---|
| Expression grammar | Alias, Alias(arg,...), nested expressions, quoted strings, bare enum/string tokens, and finite JSON-style numbers |
| Strategy metadata | Optional name, optional type (BaseStrategy), optional strategy macro, optional non-negative integer unstableBars, optional startingType (BUY or SELL) |
| Strategy rules | Required entryRule and exitRule objects or rule expression strings unless strategy is supplied |
| Composite rules | And(...) / AndRule and Or(...) / OrRule, each with exactly two child rules |
| Leaf rules | CrossedUp(...), CrossedDown(...), Over(...), Under(...), SmaCrossUp(...), SmaCrossDown(...), StopGain(...), and StopLoss(...) |
| Indicators | ClosePrice, ClosePriceIndicator, SMA(...), EMA(...), and RSI(...), with positive integer bar counts |
| Analysis criteria | Default forms of NetProfit, GrossReturn, NetReturn, MaximumDrawdown, ReturnOverMaxDrawdown, SharpeRatio, SortinoRatio, TotalFees, NumberOfPositions, or a fully qualified AnalysisCriterion class name |
| Numeric thresholds | Finite JSON-style numbers or numeric strings, with an optional trailing % for stop percentages |
Malformed JSON-looking descriptor payloads fail as syntax errors. Plain labels remain accepted only for non-JSON text. Numeric constructor arguments in canonical descriptor JSON follow the same finite JSON-number contract as v2 shorthand, and integer parameters such as bar counts must be exact integers.
Custom shorthand is registered up front with an immutable NamedAssetRegistry:
NamedAssetRegistry registry = NamedAssetRegistry.builder()
        .withDefaults()
        .registerIndicator("FastCloseSma", List.of("barCount"), args -> {
            args.requireCount(1);
            return ComponentDescriptor.builder()
                    .withType("SMAIndicator")
                    .withParameters(Map.of("barCount", args.positiveInt(0)))
                    .addComponent(ComponentDescriptor.typeOnly("ClosePriceIndicator"))
                    .build();
        })
        .build();

Indicator<?> indicator = Indicator.fromExpression(series, "FastCloseSma(5)", registry);
AnalysisCriterion criterion = AnalysisCriterion.fromExpression("NetProfit");
Custom bindings read parsed arguments through typed helpers such as
positiveInt(...), finiteNumberText(...), stringValue(...),
indicatorDescriptor(...), and ruleDescriptor(...).
Indicator aliases used in numeric comparison rules must resolve to indicators
whose runtime values are Num; boolean indicators should be composed through
boolean-aware rules instead of Over(...) / Under(...) style comparisons.
Parameterized analysis criteria serialize through canonical descriptor JSON;
compact aliases are reserved for descriptors a registry formatter can represent
without dropping constructor state.
For command-line or agent workflows, split comma-separated shorthand lists with
NamedAssetRegistry#splitTopLevel(...) instead of String#split(","); nested
forms such as Custom("a,b",SMA(7)) then remain intact.
Indicator round-tripping depends on each indicator descriptor preserving the constructor inputs needed to rebuild that indicator. Indicators that create helper indicators internally should keep their constructor arguments in serializable fields and treat rebuilt helper graphs as transient implementation state; round-trip coverage is being expanded across indicator tests.
Bar series serialization (Java):
- Bar data, the
NumFactory, and theBarBuilderFactoryconfiguration are preserved across the round-trip. ConcurrentBarSeriesreinitializes its locks after deserialization and recreates the trade bar builder lazily.- Builder state (for example, a time period set directly on the builder) must be re-applied after deserialization unless you configured it in the factory.
Features at a glance
- 190+ technical indicators (and counting) - Aroon, ATR, Ichimoku, MACD, RSI, Renko, Heikin-Ashi, and many more. New indicators are added regularly.
- Candlestick pattern coverage - Includes bullish/bearish reversal patterns such as Morning/Evening Star, Piercing Line, Dark Cloud Cover, engulfing, harami, and marubozu variants.
- Composable strategy API - Build complex trading rules using fluent Java patterns
- Built-in backtesting engine - Test strategies on years of data in seconds. Same code for backtesting and live trading — no rewrites.
- Performance metrics - 30+ analysis criteria including Sharpe ratio, drawdown, win rate, and more
- Charting support - Visualize strategies with candlestick charts, indicator overlays, and performance subcharts
- JSON serialization - Save and restore strategies and indicators for persistence and sharing
- Production-ready - Deterministic calculations, minimal dependencies, type-safe APIs
- Extensive examples - Runnable demos covering strategies, indicators, backtesting, and live trading
From backtest to live trading
The same strategies you backtest can run live. Ta4j's deterministic calculations make it safe to deploy & test thoroughly, then execute with confidence.
import org.ta4j.core.builder.BaseBarSeriesBuilder;

// Create a live series (starts empty, grows as bars arrive)
BarSeries liveSeries = new BaseBarSeriesBuilder()
        .withName("BTC-USD")
        .build();

// Build your strategy (same code as backtesting!)
Strategy strategy = buildStrategy(liveSeries);
TradingRecord tradingRecord = new BaseTradingRecord(strategy.getStartingType());
int lastEntryBarIndex = -1;
int lastExitBarIndex = -1;

// Main trading loop: check for signals on each new bar
while (true) {
    // Fetch latest bar from your exchange/broker API
    Bar latest = fetchLatestBarFromBroker();  // Your integration here
    liveSeries.addBar(latest);

    int endIndex = liveSeries.getEndIndex();

    // Check entry/exit signals (same API as backtesting)
    if (strategy.shouldEnter(endIndex, tradingRecord) && lastEntryBarIndex != endIndex) {
        placeBuyOrder();  // Place order with your exchange adapter
        // After broker confirmation/fill:
        boolean entered = tradingRecord.enter(endIndex, latest.getClosePrice(), liveSeries.numFactory().one());
        if (entered) {
            lastEntryBarIndex = endIndex;
        } else {
            // Handle state divergence: broker fill succeeded but record update failed.
            handleRecordSyncFailure("enter", endIndex);
        }
    } else if (strategy.shouldExit(endIndex, tradingRecord) && lastExitBarIndex != endIndex) {
        placeSellOrder(); // Your order execution logic
        // After broker confirmation/fill:
        boolean exited = tradingRecord.exit(endIndex, latest.getClosePrice(), liveSeries.numFactory().one());
        if (exited) {
            lastExitBarIndex = endIndex;
        } else {
            // Handle state divergence: broker fill succeeded but record update failed.
            handleRecordSyncFailure("exit", endIndex);
        }
    }

    Thread.sleep(60000); // Wait 1 minute (or your bar interval)
}
Notes:
shouldEnter(index, tradingRecord)andshouldExit(index, tradingRecord)are the recommended live overloads.- Check the return values of
tradingRecord.enter(...)andtradingRecord.exit(...); afalsemeans your record did not accept the transition and requires reconciliation. - Use symmetric deduplication guards for both entry and exit paths (
lastEntryBarIndex/lastExitBarIndex) to avoid duplicate orders on repeated signals. - ta4j evaluates whatever bar you provide at
index: replacing the last bar means live-candle evaluation; evaluating only after appending a finished bar means closed-candle evaluation. - Keep
tradingRecordsynchronized with confirmed fills (or useTradingRecord.operate(fill)for partial fills) so ta4j does not repeatedly signal entry while it still believes no position is open. - See the wiki deep-dive: Live Candle vs Closed Candle Evaluation.
Why this works:
- Same code, different data: Your strategy logic is identical for backtests and live trading
- Deterministic: Same inputs always produce same outputs - critical for testing and debugging
- Type-safe: Compile-time checks catch errors before they cost money
Execution path references:
- Single strategy backtests:
BarSeriesManager - Large batch runs and ranking:
BacktestExecutor - Fill timing/slippage/stop-limit behavior:
TradeExecutionModel - Fill-aware position state:
BaseTradingRecord
Migration note: Trade and TradingRecord surfaces
Treat Trade and TradingRecord as the primary APIs. Stream single fills directly with
TradingRecord.operate(fill), or batch one logical order with Trade.fromFills(...) and pass that through
TradingRecord.operate(...). BaseTrade and BaseTradingRecord remain the shared implementation behind those
contracts.
TradingRecord defaultBacktest = new BarSeriesManager(series).run(strategy);

TradingRecord parityBacktest = new BarSeriesManager(series).run(
        strategy,
        new BaseTradingRecord(TradeType.BUY, ExecutionMatchPolicy.FIFO,
                new ZeroCostModel(), new ZeroCostModel(), null, null));
Recording live executions
When you route orders to an exchange, stream one fill at a time with TradingRecord.operate(fill), or group an
exchange-reported batch with Trade.fromFills(...). BaseTradingRecord still tracks partial fills, multiple open
lots, and recorded fees so analytics can include open exposure.
import java.util.List;
import java.time.Instant;

import org.ta4j.core.ExecutionMatchPolicy;
import org.ta4j.core.ExecutionSide;
import org.ta4j.core.BaseTradingRecord;
import org.ta4j.core.Trade;
import org.ta4j.core.TradeFill;
import org.ta4j.core.TradingRecord;
import org.ta4j.core.Trade.TradeType;
import org.ta4j.core.analysis.CashFlow;
import org.ta4j.core.analysis.EquityCurveMode;
import org.ta4j.core.analysis.OpenPositionHandling;
import org.ta4j.core.analysis.cost.ZeroCostModel;
import org.ta4j.core.num.Num;

TradingRecord record = new BaseTradingRecord(
        TradeType.BUY,
        ExecutionMatchPolicy.FIFO,
        new ZeroCostModel(),
        new ZeroCostModel(),
        null,
        null);

TradeFill incomingFill = new TradeFill(
        -1,
        Instant.now(),
        price,
        amount,
        fee,
        ExecutionSide.BUY,
        orderId,
        correlationId);
record.operate(incomingFill);

// If the exchange already gives you multiple partial fills for one logical order,
// you can either stream them one at a time...
TradeFill batchFillOne = mapExchangeFill(partialOne);
TradeFill batchFillTwo = mapExchangeFill(partialTwo);

// Stream fills directly as they arrive
record.operate(batchFillOne);
record.operate(batchFillTwo);

// ...or, if you already have the whole batch, keep them together:
List<TradeFill> exchangeFills = List.of(batchFillOne, batchFillTwo);
record.operate(Trade.fromFills(TradeType.BUY, exchangeFills));

CashFlow equity = new CashFlow(series, record, EquityCurveMode.MARK_TO_MARKET,
        OpenPositionHandling.MARK_TO_MARKET);
Num latest = equity.getValue(series.getEndIndex());
Notes:
ExecutionMatchPolicy.SPECIFIC_IDmatches exits to the lot with a matchingcorrelationIdororderId.- Single fills need an explicit
ExecutionSidesoTradingRecord.operate(fill)can infer the right trade direction. - After deserializing a
BaseTradingRecord, callrehydrate(holdingCostModel)to restore transient cost models. - See
TradeFillRecordingExampleinta4j-examplesfor a runnable live-style walkthrough that streams fills withTradingRecord.operate(fill), contrasts that with groupedTrade.fromFills(...)recording, and shows howFIFO,LIFO,AVG_COST, andSPECIFIC_IDchange partial-exit matching.
Production readiness checklist
Before promoting a strategy from research to live execution, verify:
- Your execution assumptions match reality: Backtesting
- You pass a realism gate: Backtesting Realism Checklist
- You have startup/recovery/reconciliation procedures: Live Trading Runbook
- You have symptom-first debug paths for incidents: Troubleshooting Hub
- Your example and command links are valid in CI:
scripts/docs-integrity-check.sh
Streaming trade ingestion (gap handling)
When you need to aggregate raw trades into time bars, use ConcurrentBarSeries with a TimeBarBuilderFactory:
import java.time.Duration;
import java.time.Instant;

import org.ta4j.core.Bar;
import org.ta4j.core.ConcurrentBarSeries;
import org.ta4j.core.ConcurrentBarSeriesBuilder;
import org.ta4j.core.bars.TimeBarBuilderFactory;

ConcurrentBarSeries series = new ConcurrentBarSeriesBuilder()
        .withName("BTC-USD")
        .withBarBuilderFactory(new TimeBarBuilderFactory(Duration.ofMinutes(1)))
        .build();

Instant t0 = Instant.parse("2024-01-01T10:05:00Z");
series.ingestTrade(t0, 1, 100);
series.ingestTrade(t0.plusSeconds(150), 2, 105); // skips the 10:06 bar

LOG.info("Bars: {}", series.getBarCount()); // 2
LOG.info("Second bar begin: {}", series.getBar(1).getBeginTime()); // 2024-01-01T10:07:00Z
Time gaps are omitted; no empty bars are inserted. If your pipeline expects continuous prices, reconcile and backfill OHLCV data upstream before ingestion.
Elliott Wave quickstart
The Elliott Wave suite exposes two minimal entry points:
ElliottWaveFacadefor indicator-style, per-bar access (recommended for rules and chart overlays)ElliottWaveAnalysisRunnerfor one-shot analysis runs with pluggable detectors and confidence profiles
BarSeries series = ...;
int index = series.getEndIndex();

ElliottWaveFacade facade = ElliottWaveFacade.fractal(series, 5, ElliottDegree.INTERMEDIATE);

ElliottPhase phase = facade.phase().getValue(index);
ElliottScenarioSet scenarios = facade.scenarios().getValue(index);
Num invalidation = facade.invalidationLevel().getValue(index);
For 1-minute, 5-minute, and other live intraday series, use the causal volatility-scaled profile. The compatible default includes the forming terminal wave for live charting while reporting it separately from confirmed waves:
ElliottWaveAnalysisRunner runner = ElliottWaveAnalysisRunner.builder()
        .degree(ElliottDegree.SUB_MINUETTE)
        .logicProfile(ElliottLogicProfile.INTRADAY_LIVE)
        .build();

ElliottAnalysisResult intraday = runner.analyze(series)
        .analysisFor(ElliottDegree.SUB_MINUETTE)
        .orElseThrow()
        .analysis();
int confirmedWaves = intraday.waveCount().confirmed();
int wavesIncludingForming = intraday.waveCount().includingProvisional();
boolean primaryIsForming = intraday.scenarios()
        .base()
        .map(intraday::usesProvisionalTerminal)
        .orElse(false);
For trading rules that must act on confirmed detector pivots only, add
.includeProvisionalTerminalSwing(false) to the runner builder. Custom analysis
runners own their terminal-wave semantics.
See the Elliott Wave Indicators wiki guide for the full quickstart and runner-based workflow.
LPPL residual quickstart
LPPLResidualIndicator fits a Log-Periodic Power Law model through the bar before the requested index and evaluates the current price against that fixed path. The primary API is a regular normalized numeric indicator:
BarSeries series = ...;
int index = series.getEndIndex();

LPPLResidualIndicator residual = new LPPLResidualIndicator(series);
Num normalizedResidual = residual.getValue(index); // positive = above the path, negative = below it
Use the rich fit when model status and diagnostics affect the decision:
LPPLFit fit = residual.getFitIndicator().getValue(index);
if (fit.isQualified(residual.getProfile())) {
    double rawLogPriceResidual = fit.residual();
    double fittedCurrentLogPrice = fit.predictedLogPrice();
}
The value is the observed-minus-predicted log-price residual divided by the maximum absolute residual across the same fitted path. It is bounded to [-1, 1], but it is not by itself a valuation judgment, bubble label, or crash forecast. Warm-up bars, invalid prices, optimizer failures, and unqualified fits return NaN rather than a misleading neutral zero. LPPL calibration is substantially more expensive than ordinary rolling arithmetic: reuse getFitIndicator() when diagnostics are also needed rather than constructing a second fit indicator for the same series and profile.
Advanced scans can reuse grouped immutable tuning rather than positional parameter lists:
LPPLCalibrationProfile profile = LPPLCalibrationProfile.defaults()
        .withWindow(500)
        .withCriticalTimeSearch(1, 60, 5)
        .withOptimizerSettings(160, 0.80);
LPPLResidualIndicator tunedResidual = new LPPLResidualIndicator(series, profile);
LPPL fitting is sensitive to window selection and split/distribution discontinuities, so equity operators should use adjusted prices and validate the residual against matched trend and randomized-return controls before applying thresholds.
Real-world examples
The ta4j-examples module includes runnable examples demonstrating common patterns and strategies:
- Examples index and learning tracks - Recommended progression from first strategy to live-style workflows
Strategy Examples
- RSI2Strategy - Mean reversion strategy using RSI with entry/exit rules
- ADXStrategy - Trend-following strategy using ADX and DI indicators
- CCICorrectionStrategy - Commodity Channel Index-based correction strategy
- MovingMomentumStrategy - Momentum-based strategy with moving averages
- GlobalExtremaStrategy - Strategy using global price extrema for entries/exits
- NetMomentumStrategy - Net momentum calculation with multiple indicators
Data Loading Examples
- YahooFinanceHttpBarSeriesDataSource - Fetch historical OHLCV data from Yahoo Finance API (stocks, ETFs, crypto). Includes response caching to reduce API calls. See the Sourcing market data section above for a quick start guide.
- YahooFinanceBacktest - Complete example demonstrating Yahoo Finance data loading, advanced multi-indicator strategy (Bollinger Bands, RSI, ATR stops), backtesting, and visualization
- CoinbaseHttpBarSeriesDataSource - Load historical crypto data from Coinbase's public API with automatic caching and pagination
- CoinbaseBacktest - Complete example demonstrating Coinbase data loading, advanced multi-indicator strategy (MACD, Keltner Channels, VWAP, MFI), risk management, and transaction cost analysis
- BitStampCsvTradesFileBarSeriesDataSource - Load historical trade data from Bitstamp CSV files and aggregate into OHLCV bars
- CsvFileBarSeriesDataSource - Load OHLCV bar data from CSV files with intelligent filename pattern matching
- JsonFileBarSeriesDataSource - Parse JSON data from Coinbase/Binance APIs with flexible date filtering
Analysis & Backtesting Examples
- StrategyAnalysis - Comprehensive strategy performance analysis
- ElliottWaveIndicatorSuiteDemo - Canonical Elliott Wave scenario analysis with confidence scoring, structured reporting, and annotated charts. Defaults to an ossified classpath dataset when run without arguments; optional command-line arguments can load Yahoo Finance or Coinbase data.
- ElliottWavePresetDemo - Consolidated preset launcher with fixed ossified presets (
btc,eth,sp500) and flexible live mode where daily runs produce a five-outlook macro snapshot for the supplied ticker. See the wiki snapshot guide for the GitHub Actions monitoring workflow and local command. - ElliottWaveAdaptiveSwingAnalysis - Demonstrates adaptive/composite swing detection for scenario generation.
- ElliottWavePatternProfileDemo - Compares default and pattern-aware confidence profiles.
- ElliottWaveMultiDegreeAnalysisDemo - Shows cross-degree validation and scenario recommendation.
- ElliottWaveAnchorCalibrationHarness - Dedicated CLI/job entrypoint that scores a versioned BTC cycle-anchor registry against the locked walk-forward baseline, promotes a challenger only when every holdout gate clears, and otherwise keeps the baseline while printing the failed-gate summary plus ETH/USD and S&P 500 portability checks. Complete calibration can run for 8+ hours.
- ElliottWaveTrendBacktest - Evaluates trend-bias directionality over backtest and walk-forward windows.
- HighRewardElliottWaveBacktest - Backtests the high-reward Elliott Wave strategy presets.
- WyckoffCycleIndicatorSuiteDemo - Demonstrates the Wyckoff cycle entry points (
WyckoffCycleFacade,WyckoffCycleAnalysis) and prints phase transitions on an ossified bar series dataset - SimpleMovingAverageRangeBacktest - Compare and rank strategy parameter combinations with weighted criteria
- TradeFillRecordingExample - Walk through a live-style partial-fill workflow with
TradingRecord.operate(fill), inspectgetOpenPositions()versusgetCurrentPosition(), and compareFIFO,LIFO,AVG_COST, andSPECIFIC_IDpartial-exit matching. - TradingRecordParityBacktest - Compare next-open, current-close, and slippage execution models side by side, then verify the same fills across default, provided, and factory-configured
BaseTradingRecordruns. - BacktestPerformanceTuningHarness - Tune backtest performance (strategy count, bar count, cache window hints, heap sweeps)
Charting Examples
- IndicatorsToChart - Visualize indicators overlaid on price charts
- CandlestickChart - Basic candlestick chart with trading signals
- CashFlowToChart - Visualize cash flow and equity curves
💡 Tip: Run any example with ./mvnw -pl ta4j-examples exec:java -Dexec.mainClass=ta4jexamples.Quickstart (replace Quickstart with the class name).
Performance
Ta4j is designed for performance and scalability:
- Efficient calculations - Optimized indicator implementations with minimal overhead
- Flexible number types - Choose between
DecimalNum(precision) andDoubleNum(speed) based on your needs - Memory-efficient - Support for moving windows and sub-series to minimize memory footprint
- Parallel-friendly - Strategies can be backtested independently for easy parallelization
For performance tuning guidance, start with:
- Backtesting guide for execution-model and batch-run tradeoffs
- Num guide for precision-vs-speed decisions (
DecimalNumvsDoubleNum) BacktestPerformanceTuningHarnessfor reproducible tuning runsscripts/benchmark-backtest-throughput.shfor controlledHEAD^vsHEADcomparisons usingmatrix_performance.jsoncells/min and hypotheses/min- Performance Characterization for methodology and interpretation
Community & Support
Get help, share ideas, and connect with other Ta4j users:
- 💬 Discord Community - Active community for quick questions, strategy discussions, and real-time help
- 📖 Documentation Wiki - Comprehensive guides covering indicators, strategies, backtesting, and more
- 📚 Javadoc API Reference - Complete API documentation with examples
- 🐛 GitHub Issues - Report bugs, request features, or ask questions
- 💡 Usage Examples - Follow curated learning tracks and runnable commands
Canonical doc map
Use this map when deciding where to read next:
- Entry and quick orientation: this
README.md - Core API decision entrypoints:
ta4j-core/README.md - Runnable progression and commands:
ta4j-examples/README.md - End-to-end path from data to operations: Canonical User Journey
- Production operations: Live Trading Runbook
- Validation discipline: Backtesting Realism Checklist
- Incident debugging: Troubleshooting Hub
- Governance and freshness policy: Documentation Governance
- API migration and compatibility guidance: Migration and Version Compatibility
Canonical onboarding lane (first 60 minutes)
For the curated onboarding path, use:
- Canonical User Journey
ta4j-examples/README.mdfor runnable progression
What's next?
New to technical analysis?
- Start with the wiki's Getting Started guide to learn core concepts
- Explore the
ta4j-examplesmodule - each example is runnable and well-commented - Try modifying the quick start example above: change indicator parameters, add new rules, or test different exit conditions
Ready to go deeper?
- Browse strategy recipes for richer rule composition patterns
- Learn about portfolio metrics and risk criteria
- Check out advanced backtesting patterns like walk-forward analysis
- Use the backtesting realism checklist before promoting strategies
- Follow the live trading runbook for startup/recovery/reconciliation guidance
- Troubleshoot with the symptom-driven hub
Need help?
- See the Community & Support section above for all available resources
Contributing
- Scan the roadmap and how-to-contribute guide.
- Fork the repo, open pull requests, and join code discussions on Discord.
- See the contribution policy and Code of Conduct.
- Run
scripts/run-full-build-quiet.shorscripts/run-full-build-quiet.ps1before opening or updating a pull request. The local default repairs license headers and formatting before verification; hosted CI calls the same entrypoint with--validate-onlyto reject uncommitted repairs without modifying its checkout. Both paths include actionlint, repository script fixtures, all non-demo tests, blocking SpotBugs, and advisory JaCoCo, while preserving the raw Maven log. - For faster local quality loops, use
./mvnw -pl ta4j-core -am clean compile spotbugs:checkor./mvnw -pl ta4j-core -am test jacoco:report jacoco:checkbefore rerunning the full verification command.
Release & snapshot publishing
Ta4j uses automated workflows for publishing both snapshot and stable releases.
Snapshots
Every push to master triggers a snapshot deployment via the snapshot.yml GitHub workflow:
Snapshots are available at:
https://central.sonatype.com/repository/maven-snapshots/
Snapshots are consumed from this repository directly; they are not expected to appear in normal Maven Central release search. Portal snapshot browsing may also be unavailable independently of publishing. A green snapshot workflow means an isolated Maven consumer resolved the exact newly deployed ta4j-parent, ta4j-core, and ta4j-examples build and matched the core/examples JAR checksums.
Stable releases
Releases are automated via GitHub workflows. The scheduler builds a release dossier, validates the configured GitHub Models entry, and asks for a SemVer recommendation before dispatching the prepare workflow. The normal production path stays PR-based: merging the generated release/<version> PR with a merge commit immediately starts snapshot.yml through its master push trigger, while publish-release.yml runs release-candidate verification, validates the artifact manifest, deploys to Maven Central, tags the release, and pushes the tag, which triggers github-release.yml to create the GitHub Release. Manual publish/recovery runs retain an explicit snapshot dispatch, but the PR path does not duplicate the already-running snapshot publication. release-health.yml then verifies repo-state drift and retrieves the current snapshot's exact timestamped POM/JAR; top-level metadata remains informational because it can lag.
The prepare-release workflow also runs a Java-based removal-ready deprecation scanner: first as a release gate for due or overdue removals, then against the new snapshot version to sync managed GitHub cleanup issues with an attached report artifact.
For operator details, recovery mode, required variables/secrets, and audit artifacts, see RELEASE_PROCESS.md.
Warranty
🛡️ Ta4j and its developers guarantee your experience to meet or exceed reasonable expectations for correctness and profitability for a minimum period of one (1) year, beginning the moment you run your first ta4j-based backtest*.
Just kidding.
Ta4j is open-source software released under the MIT License. There is no warranty, express, implied, imaginary, or otherwise. Ta4j is provided as-is. Use it, fork it, break it, improve it, or walk away entirely.
Ta4j is built and maintained by developers contributing on their own time, at their own expense, and for reasons as varied as the markets themselves. For some, it’s a hobby. For others, a labor of love. Some run Ta4j inside proprietary trading stacks and choose to give back. Others contribute to open-source to offset certain download habits that, in practice, look a lot like torrenting north of a thousand terabytes of movies, TV shows, software installers, cracked plug-ins, ROM sets, The.Sims.3.Complete.Collection-RELOADED, and e-books, while maintaining a lifetime upload ratio of 0. Who can say?
What is certain is this: whoever they are, and whatever motivates them, they don’t owe you anything. If Ta4j helps you learn, experiment, or even make money, great. If it doesn’t, that’s the risk you accepted.
*Applies only to the Premium Subscription Package, which includes 24/7 technical support, guaranteed alpha, and on-demand feature requests.
(Also just kidding. There is no Premium Subscription Package.)
Powered by
