Robusta Classic - Prometheus Alert Enrichment for Kubernetes
Note: This repository contains Robusta Classic — the rule-based alert enrichment engine. For AI-powered root cause analysis, see HolmesGPT. Both can be installed together as part of the Robusta platform.
What Can Robusta Do?
How it Works | Installation | Integrations ↗ | Docs ↗ | Slack Community ↗
Compatible with kube-prometheus-stack, Prometheus Operator, and more.
Robusta integrates with Prometheus by webhook and adds features like:
- Smart Grouping - reduce notification spam with Slack threads 🧵
- AI Investigation - Kickstart alert investigation with AI (optional)
- Alert Enrichment - see pod logs and other data alongside your alerts
- Self-Healing - define auto-remediation rules for faster fixes
- Advanced Routing based on team, namespace, and more
- Problem-Detection without PromQL - generate Kubernetes-native alerts for OOMKills, failing Jobs, and more
- Change-Tracking for Kubernetes Resources to correlate alerts and rollouts
- Auto-Resolve - update external systems when alerts are resolved (e.g. Jira)
- Dozens of Integrations - Slack, Teams, Jira, and more
Don't have Prometheus? You can use Robusta without Prometheus, or install our all-in-one Kubernetes observability stack with Robusta and Prometheus included.
🔗 Integrations
Robusta integrates with a variety of tools and platforms. Click on any logo to learn more about the integration.
📤 Notification Destinations
|
Slack |
MS Teams |
Discord |
Telegram |
Google Chat |
Mattermost |
|
PagerDuty |
Opsgenie |
Jira |
ServiceNow |
|
Webhook |
|
DataDog |
VictorOps |
Rocket.Chat |
Webex |
Pushover |
Zulip |
|
Robusta UI |
Kafka |
File |
Yandex Messenger |
📊 Metrics and Alerts
|
Prometheus |
Victoria Metrics |
Grafana Alertmanager |
Thanos |
|
AWS Managed Prometheus |
Google Managed Prometheus |
Azure Managed Prometheus |
Coralogix |
🧠 AI-Powered Alert Enrichement
|
HolmesGPT |
💰 Cost Management
|
KRR (Kubernetes Resource Recommender) |
🛠️ How it works
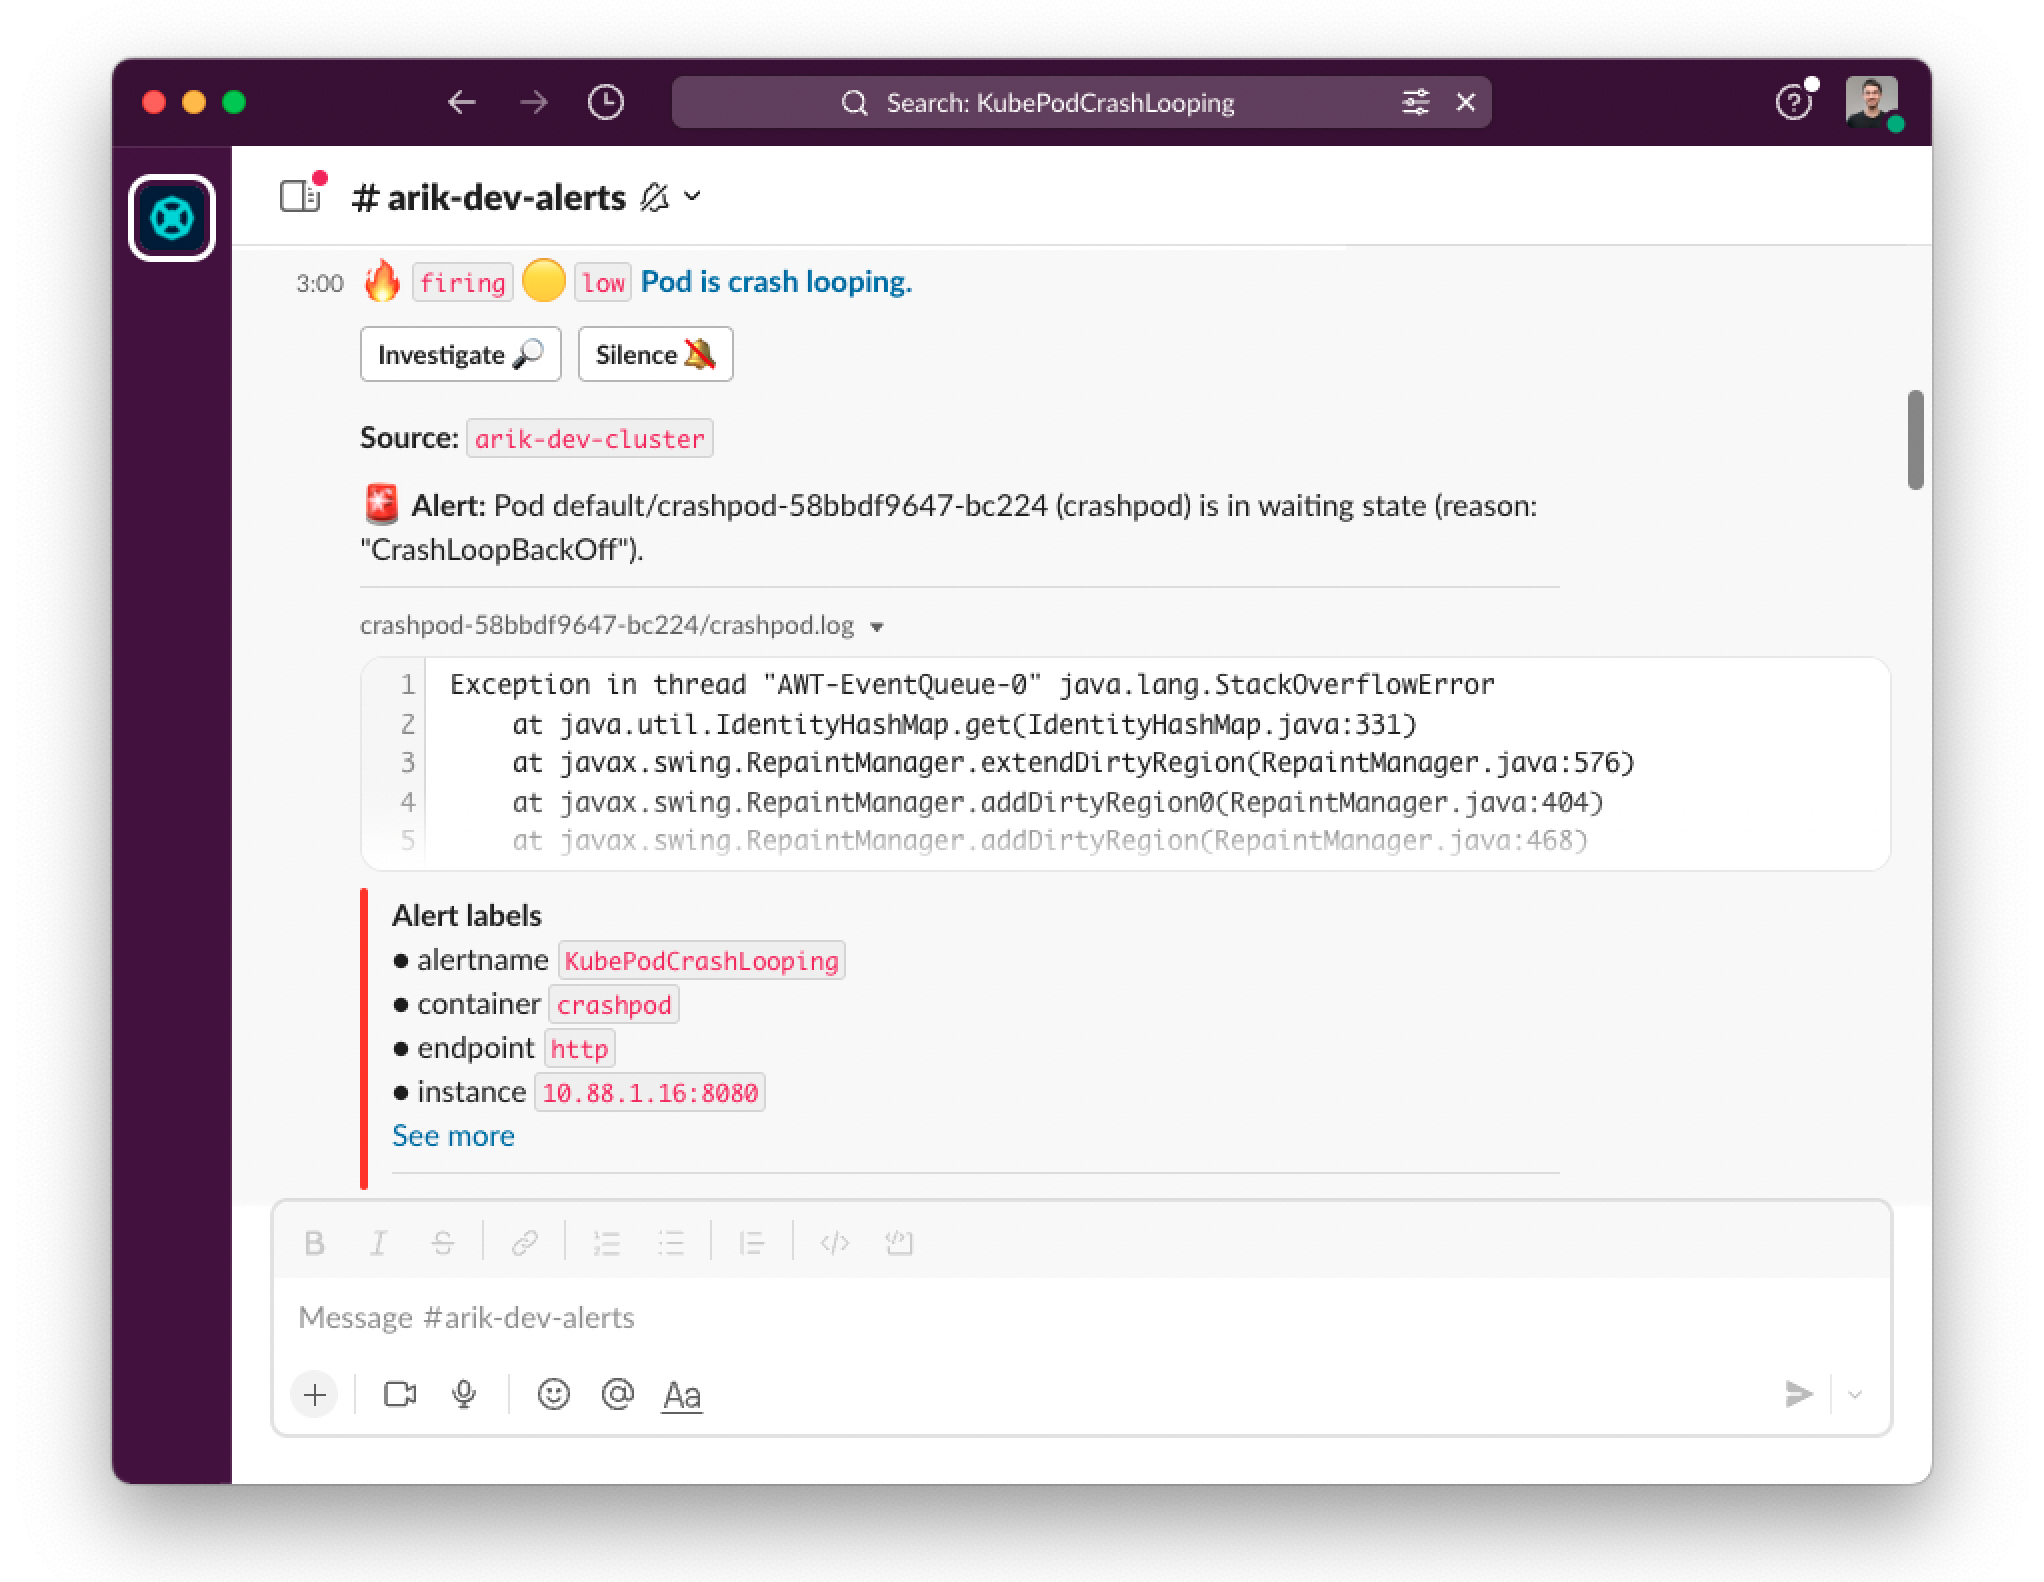
Robusta uses rules and AI to take Prometheus alerts and add extra information to them, such as pod logs, relevant graphs, possible remediations, and more.
Here is an example alert in Slack:
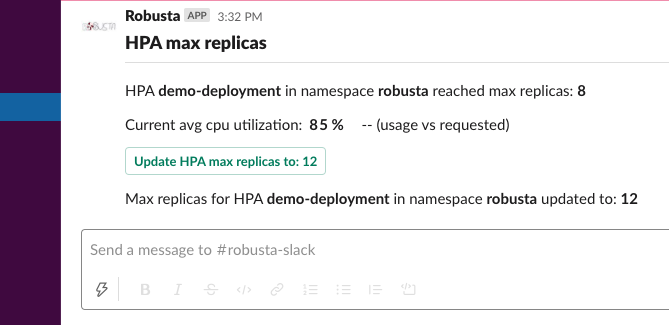
Here is an example remediation action:
📒 Installing Robusta
Robusta is installed with Helm. For convenience, we provide a CLI wizard to generate Helm values.
You can install Robusta alongside your existing Prometheus, or as an all-in-one bundle with Robusta and a preconfigured kube-prometheus-stack.
To get even more out of Robusta, we recommend creating a free Robusta UI account. Learn more below.
Create a free Robusta UI account »
🖥 Free Robusta UI
Take your Kubernetes monitoring to the next level with the Robusta SaaS platform. Creating an account is free, and includes:
-
AI Assistant: Solve alerts faster with an AI assistant that highlights relevant observability data
-
Alert Timeline: View Prometheus alerts across multiple clusters and spot correlations with a powerful timeline view
-
Change Tracking: Correlate alerts with changes to your infrastructure or applications, with Robusta's automatic change tracking for Kubernetes

📝 Documentation
Interested? Learn more about Robusta.
✉️ Contact
- Slack - robustacommunity.slack.com
- Twitter - @RobustaDev
- LinkedIn - robusta-dev
- Email Support - support@robusta.dev
📑 License
Robusta is distributed under the MIT License. See LICENSE.md for more information.
🕐 Stay up to date
We add new features regularly. Stay up to date by watching us on GitHub.